Data Analytics
What it is, why it matters, and best practices. This guide provides a data analytics definition, examples and practical advice to help you understand the topic of data and analytics.
What is Data Analytics?
Data analytics is the use of tools and processes to combine and examine datasets to identify patterns and develop actionable insights. The goal of data analytics is to answer specific questions, discover new insights, and help organizations make better, data-driven decisions.
Why is Data Analytics Important?
The insights gained from analyzing data lead to decisions and actions informed by data that can improve the performance of an organization or system far more effectively than relying on gut instinct. For example, data analytics can help a business person better understand the needs of their customers, which in turn can help shape the product offering and marketing messaging to drive growth.
The Data Analytics Process
The data analytics process is initiated with a business objective such as identifying promising new markets or weak production processes. Once these objectives are clearly defined and the data has been collected, the primary steps in the process involve using a modern data analytics tool to integrate, manage, and analyze the data and then share any findings.
1. Data Integration & Management
Before any data analysis can begin, raw data needs to be transformed into clean, business ready information. Broadly speaking, the term data-integration refers to the process of bringing together data from multiple sources across a business to provide complete, accurate, and up-to-date information for data analytics usage. It includes data replication, ingestion and transformation to combine different types of data into standardized formats stored in a repository such as a data lake or data warehouse.

-
Data replication
Data replication is the process of copying data from master sources to one or more locations. This can happen on demand, in scheduled batches, or in real time using change data capture (CDC) technology as data is written, changed, or deleted. The benefits are faster data access and better performance in addition to having an accurate backup of the data.
-
Data ingestion
This process involves moving data from a variety of sources to a storage location such as a data warehouse or data lake. The data ingestion process can be streamed in real time or in batches and typically includes cleaning and standardizing the data to be ready for a data analytics tool.
-
Data consolidation and storage
For data analytics usage, data is most often stored in a data lake or data warehouse. A data lake is a large and diverse reservoir of raw data that can be processed and used flexibly for deep analysis. A data warehouse stores structured, filtered data that’s been processed for a specific purpose.
-
Data governance
Lastly, a key element of data management is governance. A governed data catalog profiles and documents every data source and defines who in an organization can take which actions on which data. These policies and standards allow users to more easily find, prepare, use and share trusted data sets on their own, without relying on IT.
2. Data Analysis
Once raw data has been transformed into accessible, analytics-ready information, the analysis phase can begin. The goal here is to not only answer specific questions but discover new questions and unanticipated insights by exploring the data and uncovering meaningful patterns, relationships and trends. Here are seven key processes and technologies used in this phase of the data analytics process.
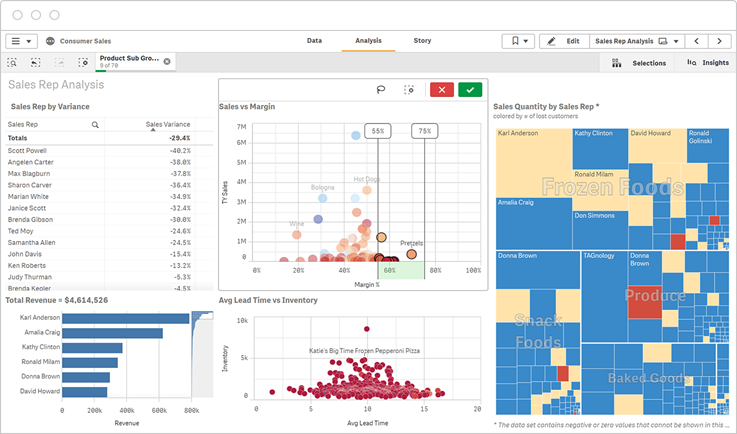
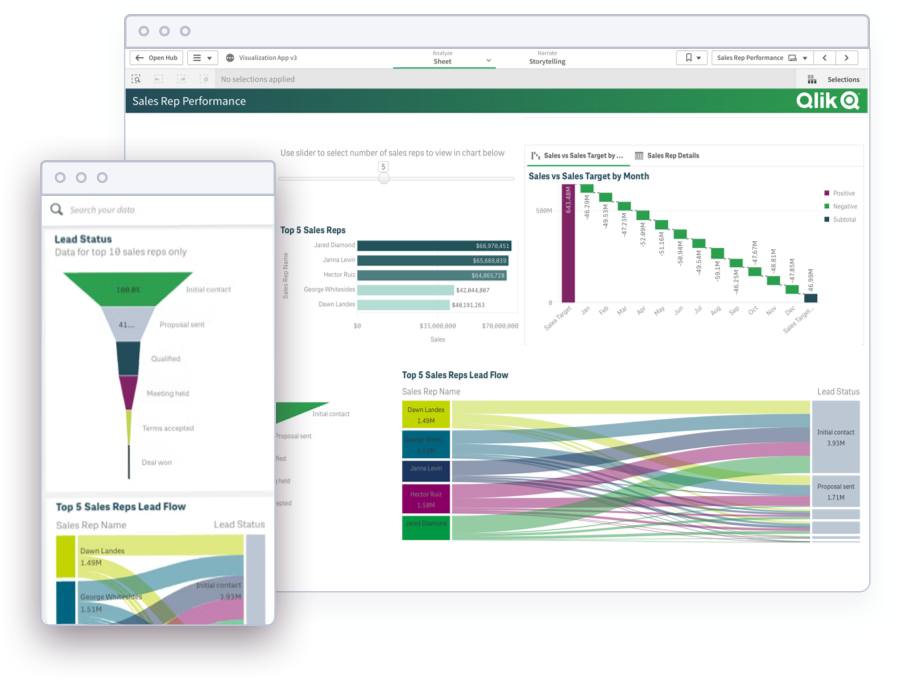
Self-service analytics, made possible by modern data analytics tools, enables users to easily analyze their data without the need for writing code. Further, a platform using an associative engine allows users to explore data freely in any direction, recalculating analytics and highlighting data relationships after each click.
Augmented analytics uses artificial intelligence (AI) and machine learning to enhance human intuition with suggested insights and analyses, automation of tasks, search & natural language interaction, and advanced analytics calculation.
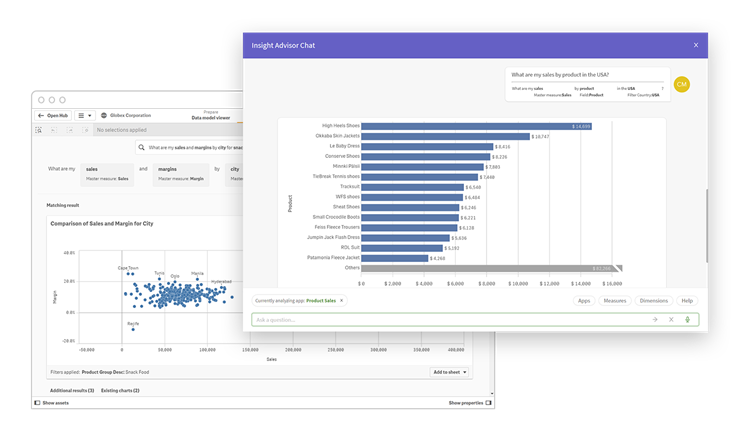
Conversational analytics lets users use natural language text chat and voice within analytics apps to explore data and discover insights. These capabilities, powered by AI, allow users to ask questions in their own words and get answers presented in an easy-to-understand conversational manner. The best data analytics platforms let users use text search and interactive selections to filter within charts, tables and other elements.
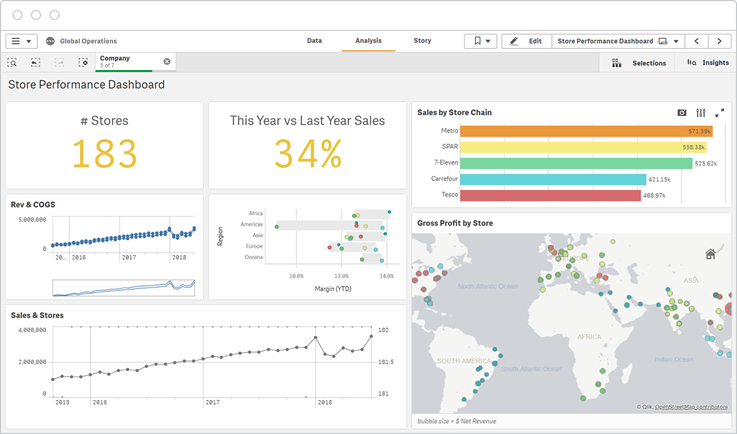
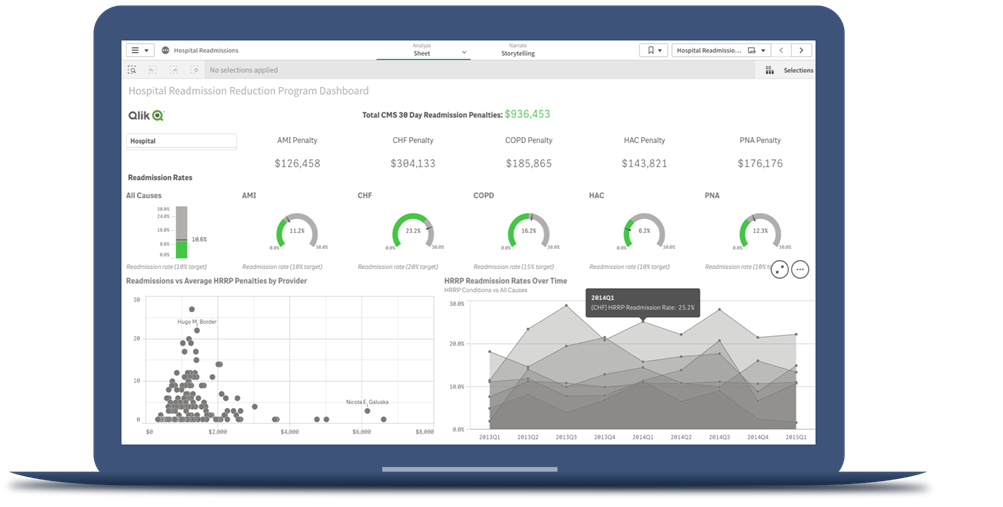
Data visualization and dashboards are an important step in the data analytics process to share information and encourage collaboration across an organization. Visualizing the data in charts, graphs and maps makes it easier for stakeholders to understand and engage with. Modern dashboards allow all users to easily dig into and explore the data themselves.
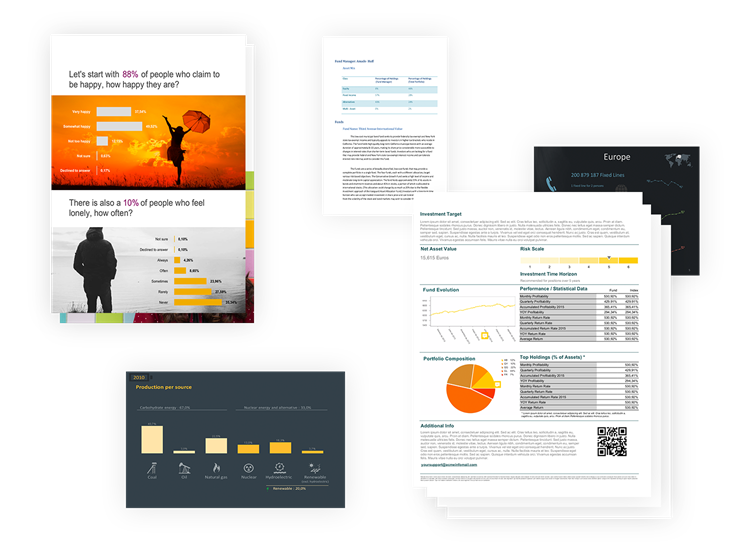
Reporting and alerting are also key ways for stakeholders to stay informed. Data analytics software should make it easy to build, publish and share static reports in all popular document formats. The software should also provide data-driven, real-time alerts to help users stay on top of their business and take timely action.

Embedded analytics integrates analytic capabilities and content within applications, products, portals, workflows or processes. This allows employees, customers, suppliers and partners to quickly access data and insights in their workflows rather than switching to a separate analytics application. In this way, embedding data analytics helps people find insights and make better decisions faster.
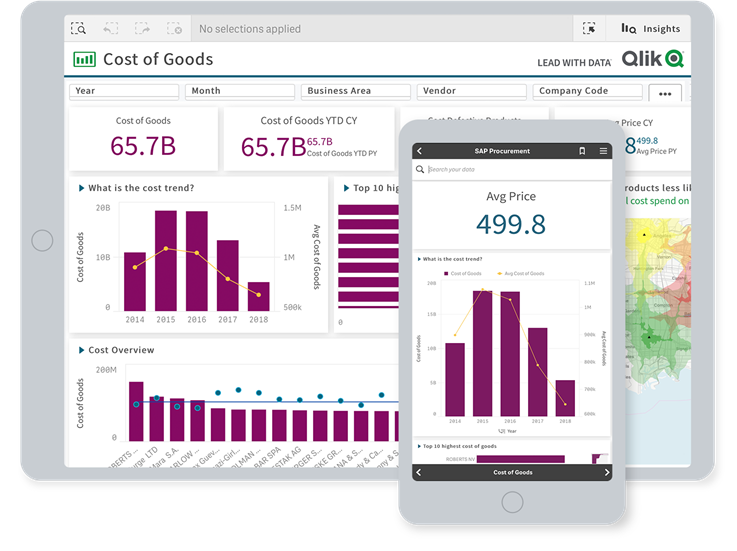
Mobile analytics means allowing users to share their analysis and collaborate with other stakeholders on any device, even if they’re offline. Given the way work happens today, users need to be able to access and analyze their data wherever they are.
Modern Analytics Demo Videos
See how to explore information and quickly gain insights.
- Combine data from all your sources
- Dig into KPI visualizations and dashboards
- Get AI-generated insights
Types of Data Analytics
Data analytics is typically categorized into four types: descriptive, diagnostic, predictive, and prescriptive.
-
Descriptive analytics focuses on answering, “What happened?” or “What is happening?” This is the most common type of data analytics and involves summarizing and analyzing historical trends in KPI dashboards, data visualizations, or reports. Descriptive analytics most often compares data between two specific time periods for given KPIs or metrics—for example, month-over-month subscriber growth or year-over-year revenue
-
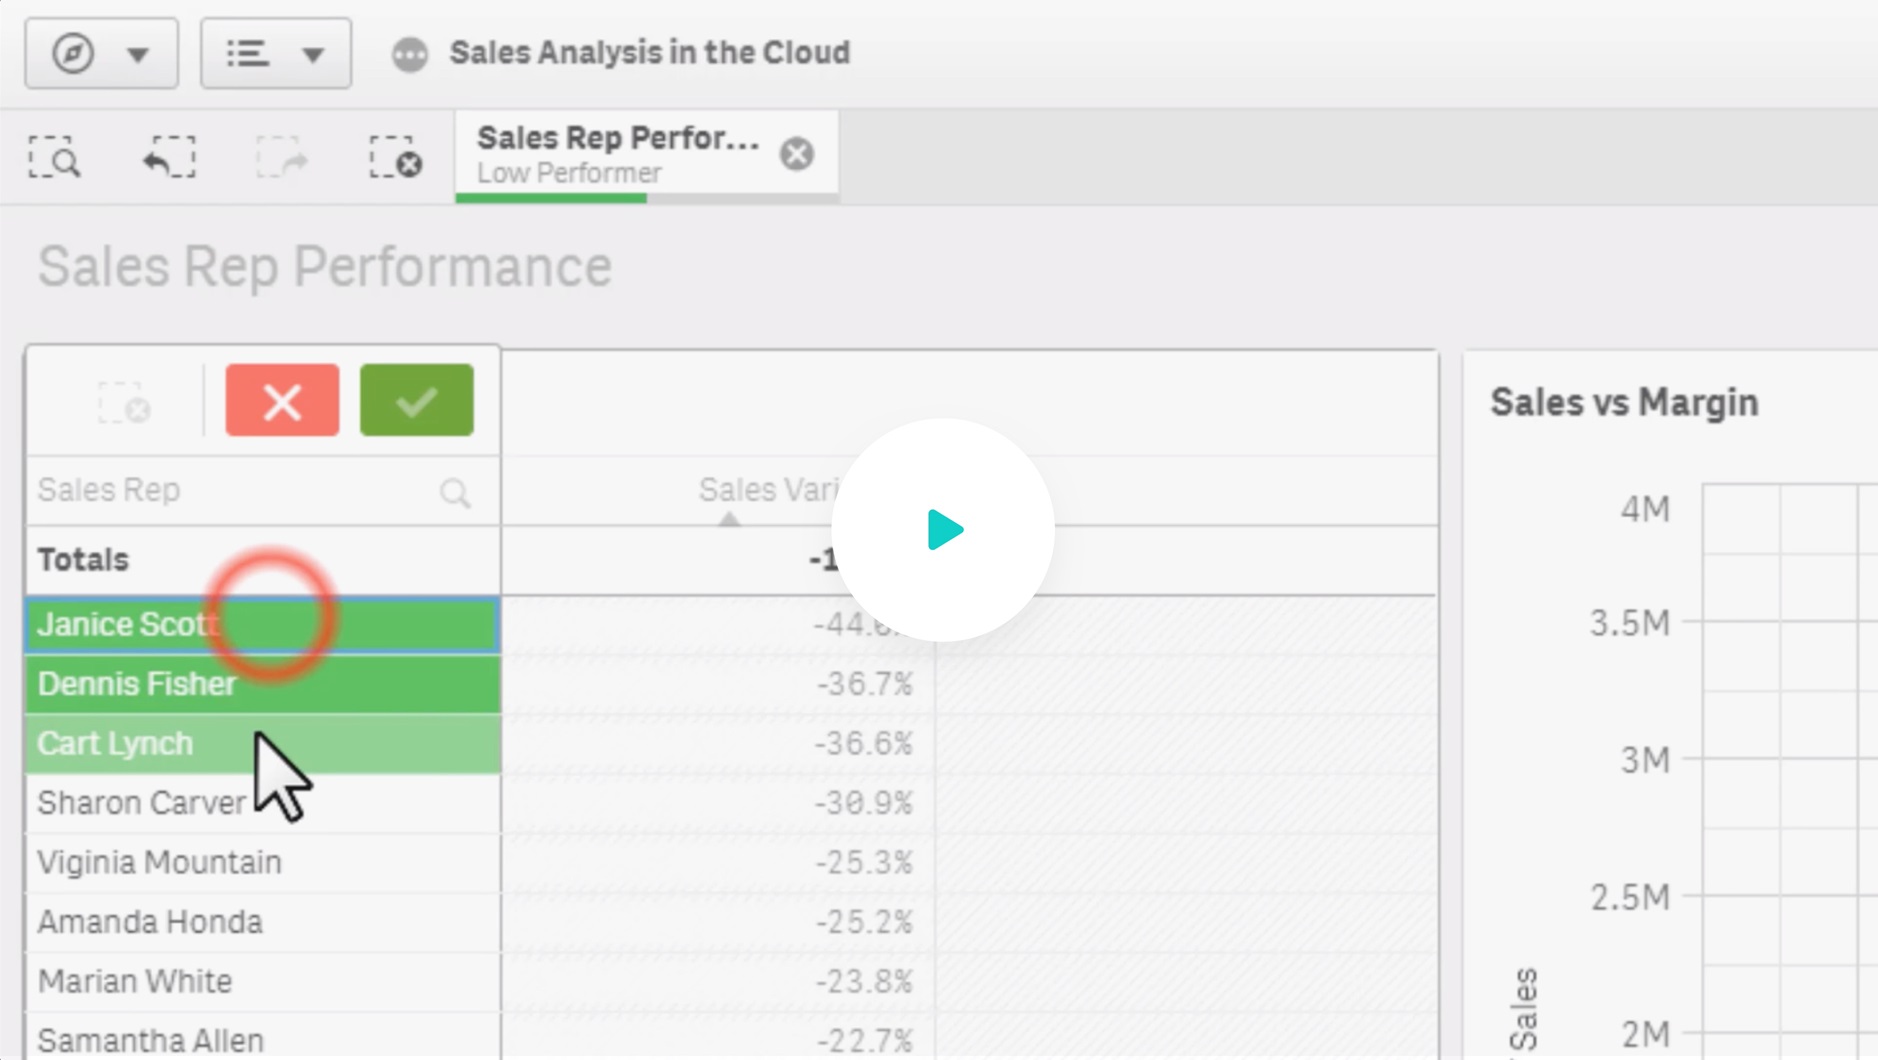
Diagnostic analytics focuses on answering, “Why did something happen?” This approach requires a more in-depth approach – developing hypotheses on what might be causing the issue and then exploring the data to find patterns and relationships. For example, a sales leader might want to know why her team is not performing well in a certain market.
-
Predictive analytics focuses on answering, “What will happen?” This type of advanced data analytics uses statistical models to identify patterns in data to project the probability of outcomes or forecast trends based on current and/or historical data. In the business world, it is used for fraud detection, sales forecasting, credit risk assessment, and other use cases.
-
Prescriptive analytics focuses on answering, “What should we do?” This approach to data analytics is used to suggest an optimal course of action based on an assessment of possible scenarios. It typically requires the expertise of data scientists working with advanced modeling techniques, though advances in AI and machine learning are making it more accessible.
Data Science vs Data Analytics
Data science and data analytics are closely related and interconnected. Still, there are key differences between the two disciplines. See the outline below or get an in-depth comparison of data science vs data analytics.
Purpose
-
Data science is focused on producing broad insights by asking questions, finding the right questions to ask and identifying areas to study.
-
Data analytics is focused on producing actionable insights that answer specific questions and can be put into action.
Scope and Skills
-
Data science is a multidisciplinary field including computer science, statistics, machine learning, and predictive analytics.
-
Data analytics is a more narrowly defined field including data integration, data analysis and data presentation.
Approach
-
Data scientists write algorithms and build predictive models and automation systems to mine large sets of both raw and structured data from a wide variety of sources.
-
Data analysts prepare and analyze well-defined datasets to identify trends and create visual presentations to help organizations make better, data-driven decisions.
FAQs
-
Data analytics is used to find patterns, relationships, and anomalies in data and make data more understandable to humans. It is used to evaluate and summarize historical data, determine the cause of specific outcomes, forecast trends, predict potential risks, and examine and suggest possible actions to take. Data analytics helps organizations improve decision making and strategic planning.
-
Big data analysis refers to the use of advanced analytics techniques such as predictive modeling, data mining, and machine learning to examine massive amounts of structured, semi-structured, and unstructured data collected by organizations at high velocity. It is used to identify hidden patterns and relationships and surface meaningful insights from high-volume, high-variety data.
-
It is technology used to convert raw data into actionable business intelligence. Companies leverage data analytics to identify key growth opportunities, detect emerging market trends, analyze and anticipate customer behavior, inform product development, optimize marketing initiatives, enhance operational efficiency, mitigate and manage risk, and inform strategic and tactical decision-making across the enterprise.