
Predictive Modeling
What it means, types and techniques. This guide provides definitions and practical advice to help you understand modern predictive modeling.
What is Predictive Modeling?
Predictive modeling is a statistical technique used to predict the outcome of future events based on historical data. It involves building a mathematical model that takes relevant input variables and generates a predicted output variable. Machine learning algorithms are used to train and improve these models to help you make better decisions. Predictive modeling is used in many industries and applications and can solve a wide range of issues, such as fraud detection, customer segmentation, disease diagnosis, and stock price prediction.
Model Types and Algorithms
The chart below lists the 7 key types of predictive models and provides examples of predictive modeling techniques or algorithms used for each type. The two most commonly employed predictive modeling methods are regression and neural networks. The accuracy of predictive analytics and every predictive model depends on several factors, including the quality of your data, your choice of variables, and your model's assumptions.
| Predictive Model Types | Predictive Modeling Techniques |
|---|---|
|
1. Regression
|
Linear regression, polynomial regression, and logistic regression.
|
|
2. Neural network
|
Multilayer perceptron (MLP), convolutional neural networks (CNN), recurrent neural networks (RNN), backpropagation, feedforward, autoencoder, and Generative Adversarial Networks (GAN).
|
|
3. Classification
|
Decision trees, random forests, Naive Bayes, support vector machines (SVM), and k-nearest neighbors (KNN).
|
|
4. Clustering
|
K-means clustering, hierarchical clustering, and density-based clustering.
|
|
5. Time series
|
Autoregressive integrated moving average (ARIMA), exponential smoothing, and seasonal decomposition.
|
|
6. Decision tree
|
Classification and Regression Trees (CART), Chi-squared Automatic Interaction Detection (CHAID), ID3, and C4.5.
|
|
7. Ensemble
|
Bagging, boosting, stacking, and random forest.
|
Now we’ll describe these predictive models and the key algorithms or techniques used for each and show simple examples of how you might visualize optimal model predictions.
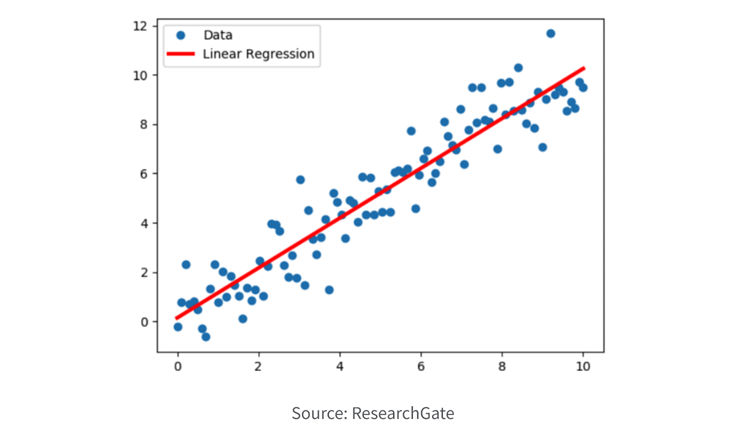
1. Regression
Regression models are used to predict a continuous numerical value based on one or more input variables. The goal of a regression model is to identify the relationship between the input variables and the output variable, and use that relationship to make predictions about the output variable. Regression models are commonly used in various fields, including financial analysis, economics, and engineering, to predict outcomes such as sales, stock prices, and temperatures.
Regression model algorithms:
- Linear regression models assume that there is a linear relationship between the input variables and the output variable.
- Polynomial regression models assume a non-linear relationship between input and output.
- Logistic regression models are used for binary classification problems, where the output variable is either 0 or 1.
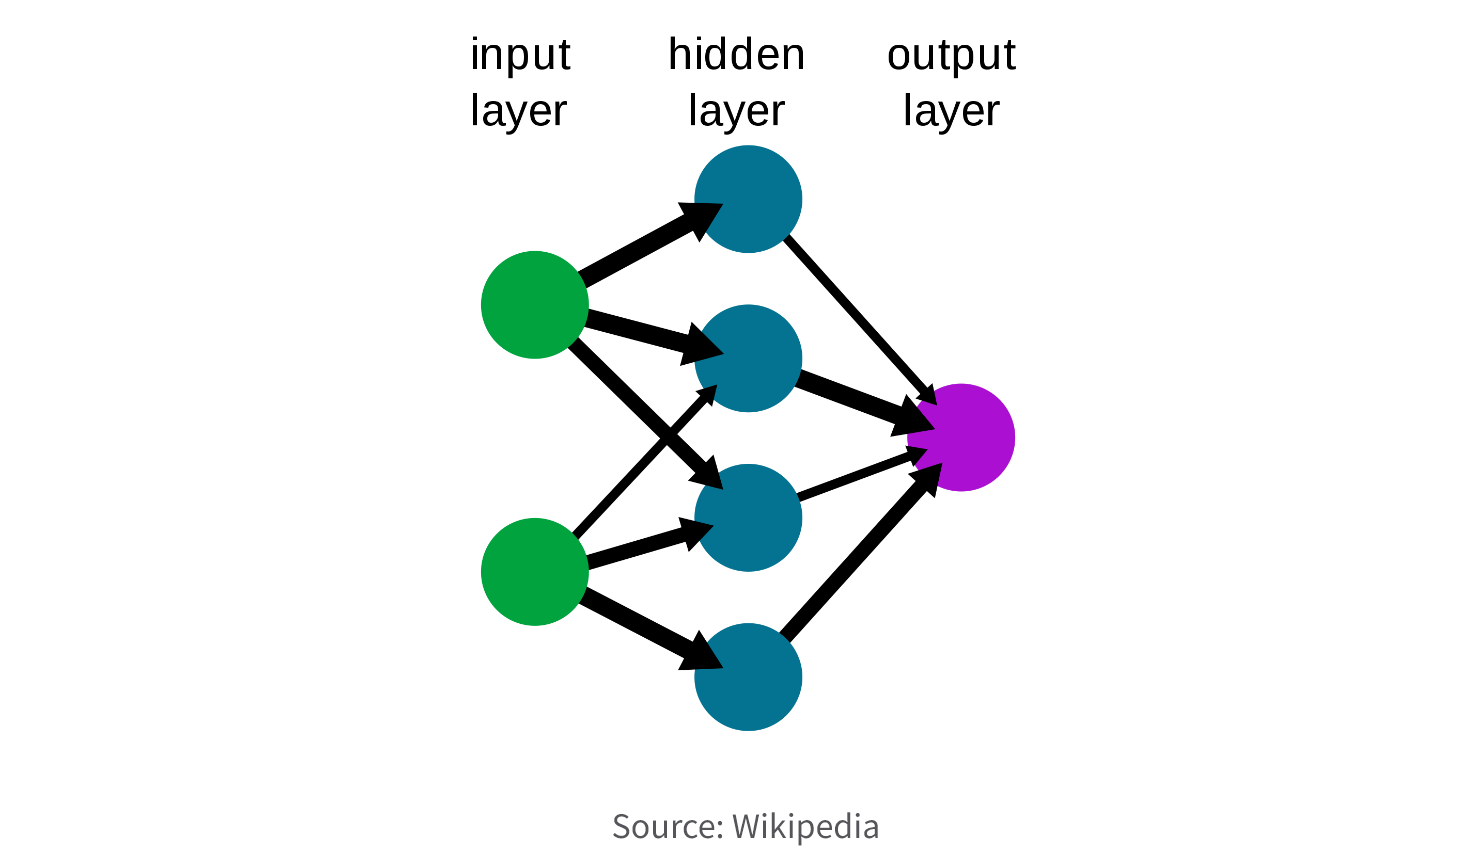
2. Neural Network.
Neural network models are a type of predictive modeling technique inspired by the structure and function of the human brain. The goal of these models is to learn complex relationships between input variables and output variables, and use that information to make predictions. Neural network models are often used in fields such as image recognition, natural language processing, and speech recognition, to make predictions such as object recognition, sentiment analysis, and speech transcription.
Neural network model algorithms:
- Multilayer Perceptron (MLP) consists of multiple layers of nodes, including an input layer, one or more hidden layers, and an output layer. The nodes in each layer perform a mathematical operation on the input data, with the output of one layer serving as the input for the next layer. The weights between the nodes are adjusted during training using backpropagation to minimize the error between the predicted output and the actual output. MLP is a versatile algorithm that can be used for a wide range of predictive modeling tasks, including classification, regression, and pattern recognition.
- Convolutional neural networks (CNN) are commonly used for image recognition tasks, with each layer processing increasingly complex features of the image.
- Recurrent neural networks (RNN) are used for sequential data, such as natural language processing, and incorporate feedback loops that allow previous output to be used as input for the next prediction.
- Long Short-Term Memory (LSTM) is a type of RNN that addresses the vanishing gradient problem and is particularly useful for learning long-term dependencies in sequential data.
- Backpropagation is a common algorithm used to train neural networks by adjusting the weights between nodes in the network based on the error between the predicted output and the actual output.
- Feedforward neural networks consist of layers of nodes that process information from previous layers, with each node performing a mathematical operation on the input data.
- Autoencoder is used for unsupervised learning, where the network is trained to reconstruct the input data and can be used for tasks such as dimensionality reduction and anomaly detection.
- Generative Adversarial Networks (GAN) involves two neural networks, one that generates synthetic data and another that discriminates between real and synthetic data, and is commonly used for tasks such as image generation and data synthesis.
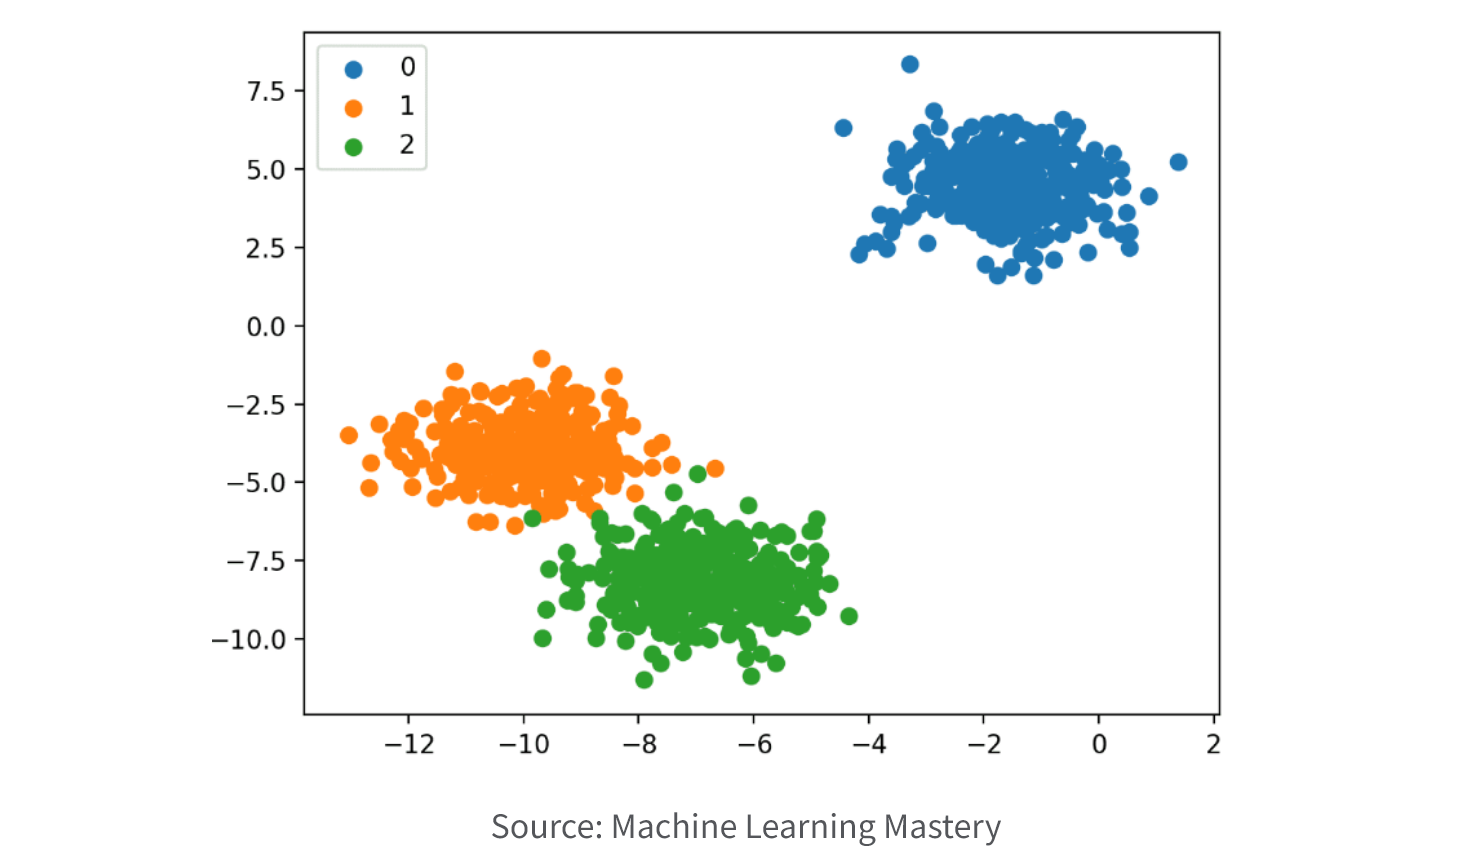
3. Classification.
Classification models are used to classify data into one or more categories based on one or more input variables. Classification models identify the relationship between the input variables and the output variable, and use that relationship to accurately classify new data into the appropriate category. Classification models are commonly used in fields like marketing, healthcare, and computer vision, to classify data such as spam emails, medical diagnoses, and image recognition.
Classification model algorithms:
- Decision trees are a graphical representation of a set of rules used to make decisions based on a series of if-then statements.
- Random forests are an ensemble method that combines multiple decision trees to improve accuracy and reduce errors.
- Naive Bayes is a probabilistic model that assumes independence between input variables
- Support vector machines (SVM) and k-nearest neighbors (KNN) are distance-based models that use mathematical algorithms to classify data.
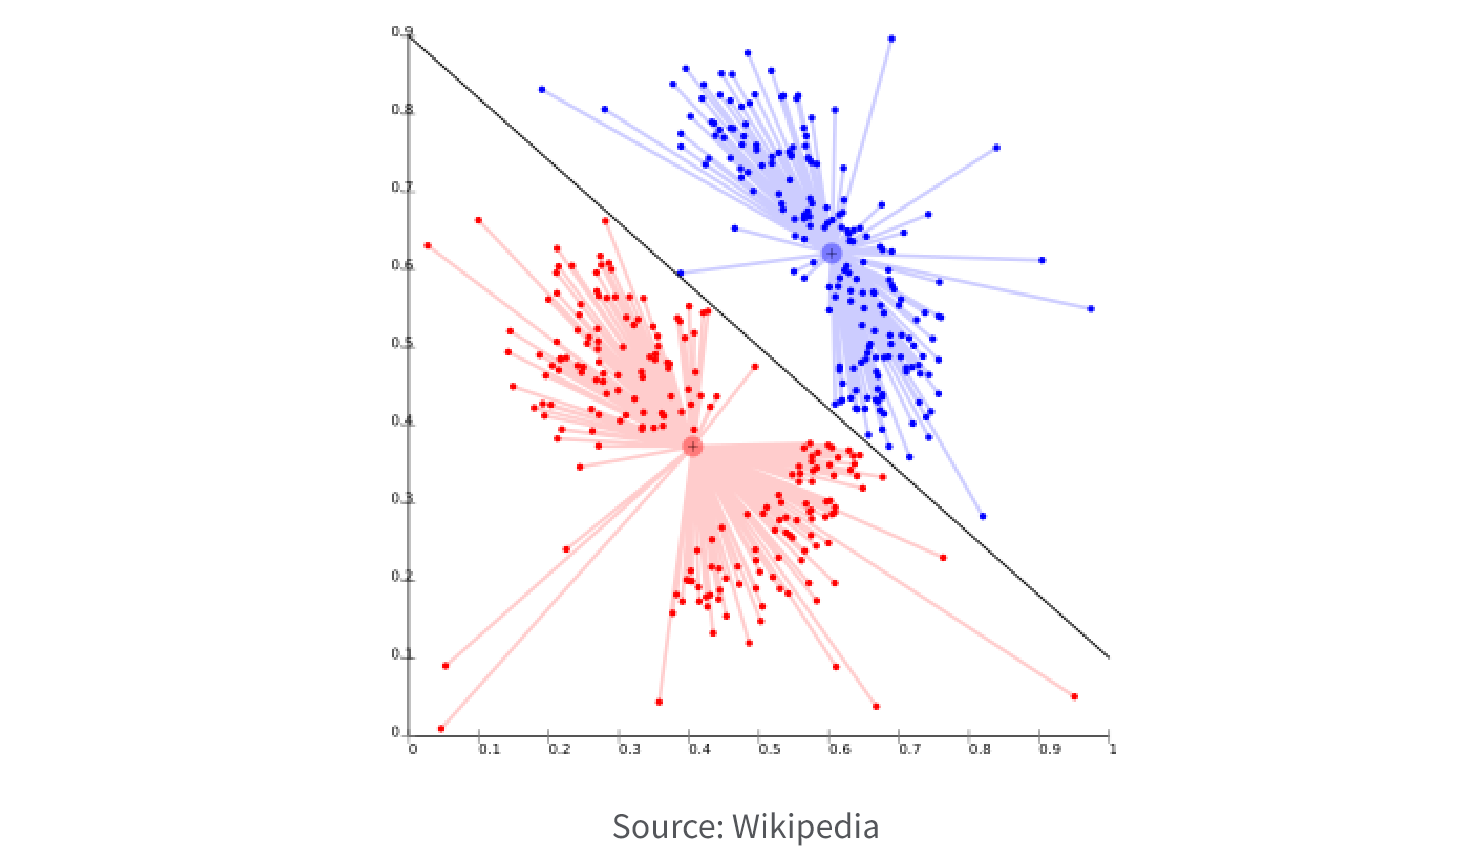
4. Clustering.
Clustering models are used to group data points together based on similarities in their input variables. The goal of a clustering model is to identify patterns and relationships within the data that are not immediately apparent, and group similar data points into clusters. Clustering models are typically used for customer segmentation, market research, and image segmentation, to group data such as customer behavior, market trends, and image pixels.
Clustering model algorithms:
- K-means clustering is a popular method that partitions the data into k clusters based on the distances between data points.
- Hierarchical clustering creates a tree-like structure of nested clusters based on the distances between data points.
- Density-based clustering groups data points based on their density in a particular area.
5. Time series.
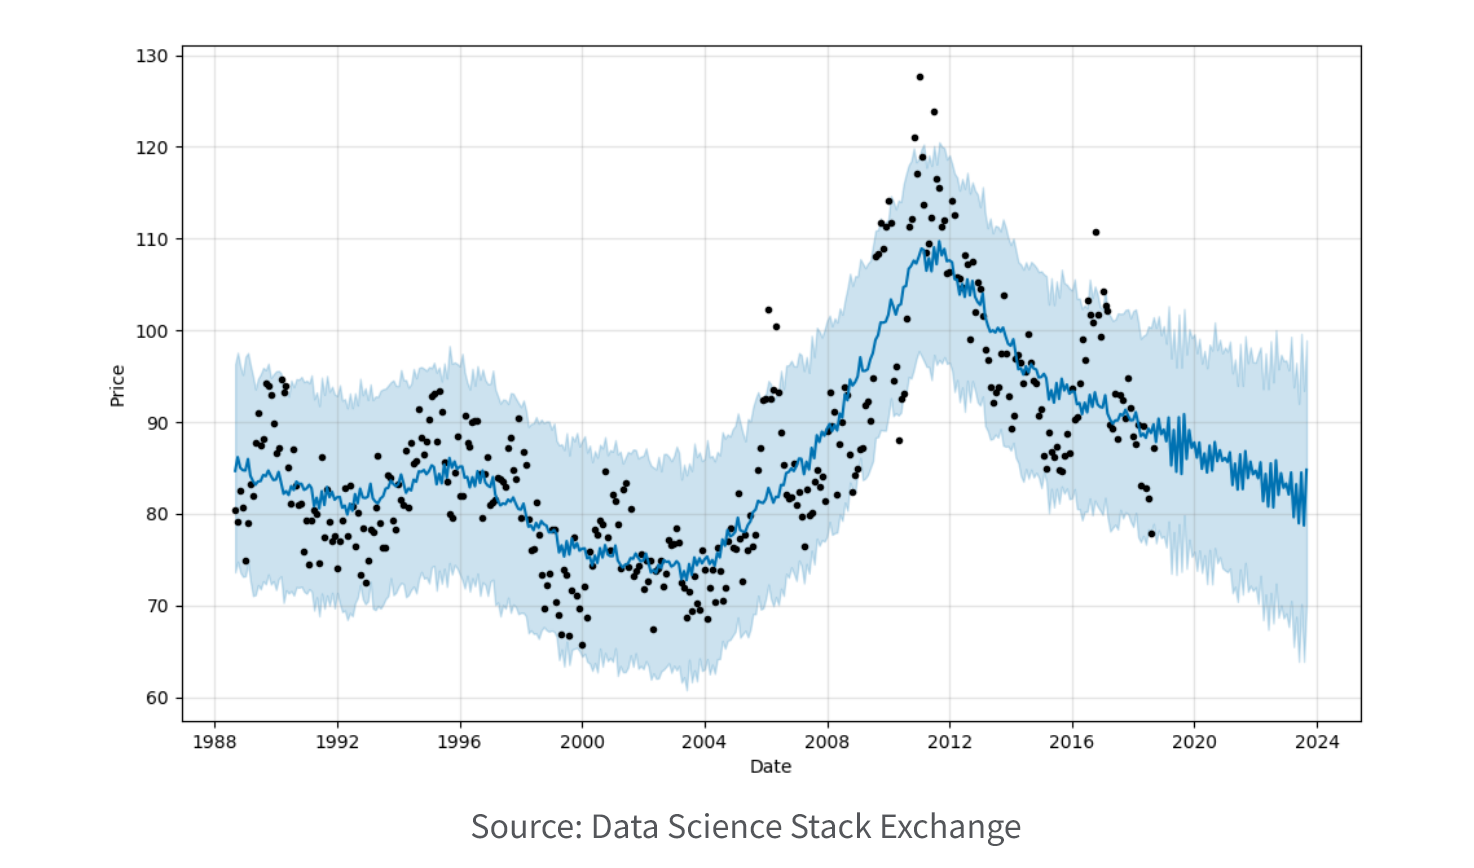
Time series models are used to analyze and forecast data that varies over time. Time series models help you identify patterns and trends in the data and use that information to make predictions about future values. Time series models are used in a wide variety of fields, including financial analytics, economics, and weather forecasting, to predict outcomes such as stock prices, GDP growth, and temperatures.
Time series model algorithms:
- ARIMA (autoregressive integrated moving average) algorithms use previous values of a time series to predict future values, taking into account factors such as seasonality, trends, and stationarity.
- Exponential smoothing algorithms use a weighted average of past observations to predict future values, and are particularly useful for short-term forecasting.
- Seasonal decomposition algorithms decompose the time series into seasonal, trend, and residual components, and then use those components to make predictions.
6. Decision Tree.
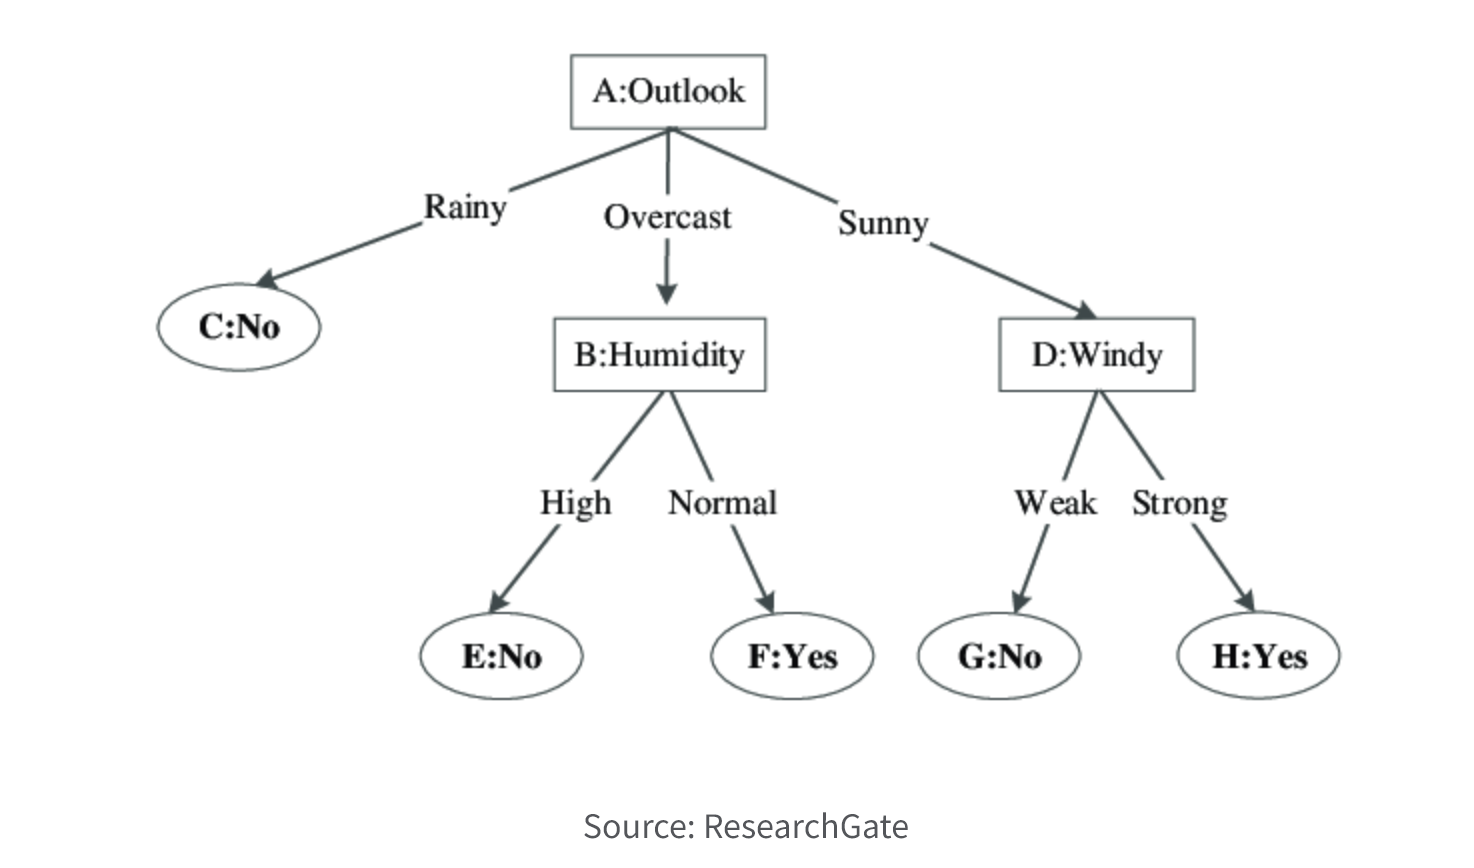
Decision tree models use a tree-like structure to model decisions and their possible consequences. The tree consists of nodes that represent decision points, with branches representing the possible outcomes or consequences of each decision. Each node corresponds to a predictor variable and each branch corresponds to a possible value of that variable. The goal of a decision tree model is to predict the value of a target variable based on the values of the predictor variables. The model uses the tree structure to determine the most likely outcome for a given set of predictor variable values.
Decision tree models can be used for both classification and regression tasks. In a classification tree, the target variable is categorical, while in a regression tree, the target variable is continuous. Decision tree models are easy to interpret and visualize, making them useful for understanding the relationships between predictor variables and the target variable. However, they can be prone to overfitting and may not perform as well as other predictive modeling techniques on complex datasets.
Decision tree model algorithms:
- CART (Classification and Regression Tree) can be used for both classification and regression tasks. It uses Gini impurity as a measure of the quality of a split, aiming to minimize it. CART constructs binary trees, where each non-leaf node has two children.
- CHAID (Chi-squared Automatic Interaction Detection) is used for categorical variables and constructs trees based on chi-squared tests to determine the most significant associations between the predictor variables and the target variable. It can handle both nominal and ordinal categorical variables.
- ID3 (Iterative Dichotomiser 3) is used to build decision trees for classification tasks. It selects the attribute with the highest information gain at each node to split the data into subsets. Information gain is calculated based on the entropy of the subsets.
- C4.5 is an extension of the ID3 algorithm that can handle both categorical and continuous variables. It uses information gain ratio to select the splitting attribute, which takes into account the number of categories and their distribution in the subsets.
These algorithms use various criteria to determine the optimal split at each node, such as information gain, Gini index, or chi-squared test.
7. Ensemble
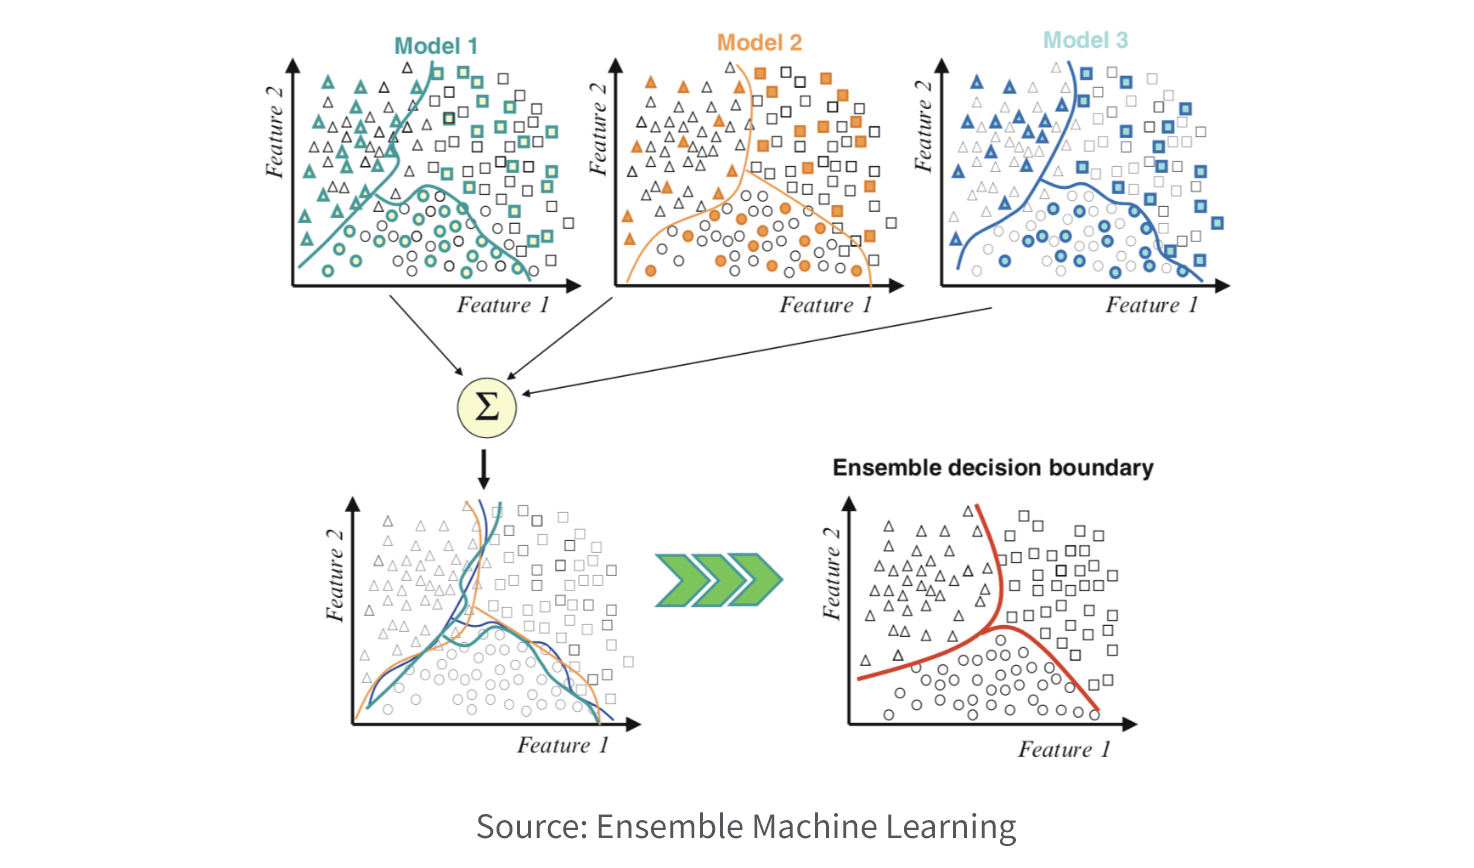
Ensemble models combine multiple models to improve their predictive accuracy and stability. By combining multiple models, the errors and biases of individual models are usually reduced, leading to better overall performance. Ensemble models can be used for both classification and regression tasks and are well suited for data mining. They’re often used in machine learning or AI competitions and real-world applications where high predictive accuracy is required.
Ensemble model algorithms:
- Bagging (Bootstrap Aggregating) involves creating multiple versions of the same prediction model on different subsets of the training data, and then aggregating their predictions to make the final prediction. Bagging is used to reduce the variance of a single model and improve its stability.
- Boosting involves creating multiple weak models sequentially, where each model tries to correct the errors of the previous model. Boosting is used to reduce the bias of a single model and improve its accuracy.
- Stacking involves training multiple models and using their predictions as input to a meta-model, which then makes the final prediction. Stacking is used to combine the strengths of multiple models and achieve better performance.
- Random Forest is an extension of bagging that uses decision trees as the base models. Random Forest creates multiple decision trees on different subsets of the training data, and then aggregates their predictions to make the final prediction.
Dashboard Demo Videos
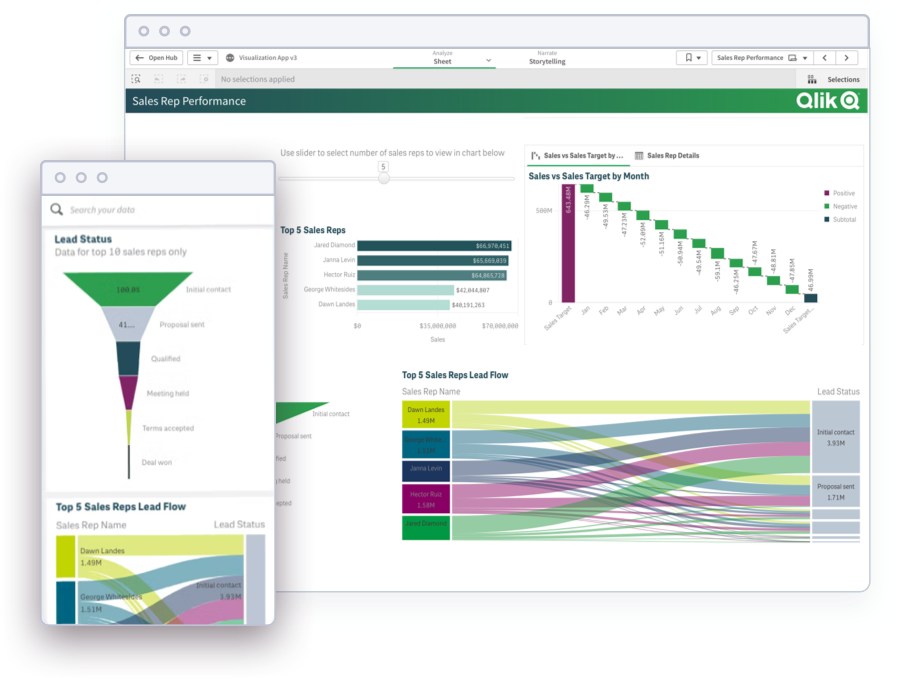
See how to explore information and quickly gain insights.
- Combine data from all your sources
- Dig into visualizations and dashboards
- Get AI-generated insights
Best Practices: 10-Step Process
Your specific workflow to develop a predictive model will depend on the types of data you’re working with and the details of your specific use case. Still, here’s a high-level overview of the 10 key steps.

1) Define goals. Before proceeding with model development, it’s essential to have a well-defined business question or problem that needs to be addressed. This means that you should identify what you want to predict precisely. Having a clear understanding of the desired project outcome will help you determine the necessary data and enable your predictive model to produce an actionable result.
2) Build team. Although new tools have made predictive modeling more accessible, it is still important to have a team with five critical members:
- An executive sponsor who can secure funding and prioritize the project.
- A line-of-business manager with a deep understanding of the business problem you want to solve.
- A data wrangler or someone with expertise in data management to clean, prepare, and integrate the data. Although modern analytics and BI tools often have data integration capabilities.
- An IT manager responsible for implementing the appropriate AI analytics infrastructure.
- A data scientist to build, refine, and deploy models. However, with the rise of AutoML tools, data analysts can now perform these tasks if the prediction model is not too complex.
3) Collect and prepare data. Now you’re ready to gather relevant data from various sources. This includes structured data like sales history and demographic information, as well as unstructured data like social media content, customer service notes, and web logs. Once you have all the data, your team will preprocess it to clean, transform, and normalize the data to remove any noise or inconsistencies. To properly prep your data, follow these steps:
- Correctly label and format your dataset.
- Ensure data integrity by cleaning up incomplete, missing, or inconsistent data.
- Avoid data leakage and training-serving skew.
- Review your dataset after importing to ensure accuracy.
Since you'll likely be working with big data, including real-time streaming data, you'll need the appropriate tools. Cloud data warehouses can now provide the necessary storage, power, and speed at an affordable cost.
4) Select predictors. This step, called feature engineering, is when you choose and create relevant features (predictors) that can help improve the accuracy of your predictive model. You want to transform raw data into meaningful features that capture the underlying patterns and relationships in the data. Some techniques you can use include data exploration, scaling, normalization, dimensionality reduction, encoding categorical variables, creating new variables through mathematical operations, and feature selection based on statistical tests or domain knowledge. Your goal is to extract the most informative features that can help the model learn the underlying patterns in the data and make accurate predictions.
5) Choose model. To select the predictive modeling technique for your problem, you need to consider the type of data you have and the specific problem you’re trying to solve. Some models work better for certain types of data than others. For example, if you have a lot of numerical data, you might consider linear regression or a decision tree model. If you have image data, you might consider a convolutional neural network.
It's also important to consider the complexity of the model and the interpretability of its output. If you need explainable AI (being able to understand the relationship between the input features and the output prediction), you might want to choose a simpler model like linear regression. If you need a highly accurate prediction and explainability is less important, you might consider a more complex one like a deep neural network.
Ultimately, the best way to select an appropriate prediction model is through experimentation and evaluation. Try out different models and compare their performance on a validation set or through cross-validation. Choose the one that gives you the best accuracy and meets your specific needs for interpretability, complexity, and performance.
6) Train model. Once you’ve selected the appropriate model, the next step is to optimize its parameters and fine-tune it for accuracy. This involves finding the best set of parameter values that will result in the highest accuracy on your training data.
To optimize the parameters, you can use techniques like grid search or randomized search, which involve systematically testing different combinations of parameter values and evaluating their performance. Once you’ve found the optimal set of parameters, you can fine-tune the model by adjusting the learning rate or regularization to improve its accuracy further.
It's important to validate the performance of the optimized model on a validation set or through cross-validation to ensure that it is not overfitting to the training data. Overfitting can occur when the model is too complex and fits too closely to the training data, resulting in poor performance on new data.
7) Evaluate model. To evaluate the performance of your model, you can use a validation set or cross-validation. This involves testing the model on a separate dataset that was not used for training, to ensure that it can generalize well to new data. With a validation set, you can split your data into a training set and a validation set. You can train your model on the training set and then evaluate its performance on the validation set. You can use metrics like accuracy, precision, recall, and F1 score to assess the model's performance and refine it if necessary.
With cross-validation, you can partition your data into multiple folds, train the model on each fold, and then evaluate its performance on the remaining folds. This allows you to test the model's performance on different subsets of the data and reduce the risk of overfitting.
Based on the results of the evaluation, you can refine your model by adjusting the hyperparameters, selecting different features, or choosing a different model altogether. By iteratively evaluating and refining your model, you can improve its performance and make it more effective for making accurate predictions on new data.
8) Adjust hyperparameters. Hyperparameters are parameters that are set before training the model, such as the learning rate, regularization strength, or the number of hidden layers in a neural network. To prevent overfitting and improve the performance of your predictive model, you can adjust these hyperparameters. Techniques like grid search or randomized search can help you find the optimal hyperparameter values. Validating the performance of the optimized model on a separate test set is crucial to ensure its generalization ability.
9) Validate model. You’re almost there! Your last step before deployment is to measure the final performance of your model and verify that it meets the desired accuracy and other requirements. Here you use a test set, which is a separate dataset that was not used for training or validation and is used to evaluate the model's performance on unseen data. It's important to ensure that the test set is representative of the data your model will encounter in the real world. This means that the distribution of the test set should be similar to the distribution of the data the model will encounter in production.
10) Deploy your model. Now you’re finally ready to integrate your model into the relevant application or system and deploy it in production to start making predictions. Integrating into an application or system may involve creating an API or a library that can be called from the application to make predictions based on new data. The model can also be integrated into a database or a data processing pipeline to automatically make predictions on incoming data.
Before deploying your model in production, it's important to ensure that it meets the performance and reliability requirements of the application or system. This may involve setting up monitoring and alerting systems to detect and address any issues that may arise during deployment. Plus, you may need to regularly maintain and update your model to ensure it remains effective and accurate over time.
Benefits
In today's data-driven world, your organization is likely inundated with massive amounts of complex and rapidly changing data from various sources. Augmented analytics such as predictive modeling, predictive analytics, and prescriptive analytics can help you leverage this big data to enhance your decision-making processes and improve overall performance. Whether it's optimizing revenue, streamlining operations, or combating fraud, predictive modeling empowers you to make data-driven decisions that are less susceptible to human bias and error. This allows you to focus on executing your plans instead of wasting time second-guessing decisions.
Improved decision-making: Gain insights into future trends and patterns, enabling you to make informed decisions based on data-driven insights.
Increased efficiency: Automate processes and streamline your operations, reducing the time and effort required to perform complex analyses.
Enhanced accuracy: Use large amounts of data to identify patterns and make predictions, resulting in more accurate forecasts than traditional methods.
Better risk management: Get help identifying potential risks and mitigate them before they occur, reducing the likelihood of financial loss or other negative outcomes.
Increased customer satisfaction: Better understand your customers' needs and preferences, leading to improved products and services that better meet your customers' needs.
Competitive advantage: Gain a competitive advantage by identifying and acting on opportunities faster and more effectively than your competitors.
Challenges
While predictive modeling has numerous benefits, it also presents some key challenges:
Poor quality data, such as data with missing values or outliers, can negatively impact the accuracy of your models.
Overfitting occurs when your model is too complex and fits the training data too closely. This can result in a model that performs well on the training data but fails to generalize to new data.
Model interpretability can also be an issue if your model is too complex. This makes it challenging for you to understand how it arrived at its predictions.
Selection bias can occur if your training data is not representative of the population being studied. This can lead to inaccurate predictions and unfair outcomes.
Unforeseen changes in the future can render your model inaccurate since it is based on historical data. Unexpected changes can be especially problematic for models that are used for long-term predictions.
Predictive Modeling Examples
Predictive modeling is used across a wide range of industries and job roles, and the following are some examples of use cases in different industries.
-
In the financial services sector, it’s used to forecast the likelihood of loan default, identify and prevent fraud, and predict future price movements of securities.
-

Insurance companies use it to assess policy applications based on the risk pool of similar policyholders, in order to predict the likelihood of future claims.
-
Healthcare companies use it to better manage patient care by forecasting patient admissions and readmissions.
-
Retailers and CPG companies use it to analyze the effectiveness of past promotional activity, and to predict which offers are most likely to be successful.
-
In manufacturing and supply chain operations, it’s used to forecast demand, manage inventory more effectively, and identify factors that lead to production failures.
-
Energy and utilities use it to mitigate safety risks by analyzing historical equipment failures, and to predict future energy needs based on previous demand cycles.
-
The public sector uses it to analyze population trends, and to plan infrastructure investments and other public works projects accordingly.
-
Life sciences organizations use it to develop patient personas and predict the likelihood of nonadherence to treatment plans.
Predictive Modeling vs Predictive Analytics
Predictive modeling is such an important part of predictive analytics, the two terms are often used interchangeably. However, predictive modeling is a subset of predictive analytics, and refers specifically to the modeling stage of the overall process.

Predictive analytics, is a broad term that encompasses the entire process of using data, statistical algorithms, and machine learning techniques to make predictions about future events or outcomes. This includes everything from data preparation and cleansing, to data integration and exploration, developing and deploying models, and collaborating and sharing the findings.
As stated above, predictive modeling refers to the process of using statistical algorithms and machine learning techniques to build a mathematical model that can be used to predict future outcomes based on historical data.


