Data Analytics Tools
2022 reviews of top data analysis software. This guide provides an in-depth comparison of the top data analysis software and offers practical advice to help you select the right solution for your organization.
What Are Data Analytics Tools?
Data analytics tools allow users to find patterns, trends, and relationships in their data. These insights help them make smarter decisions, anticipate risk, and identify opportunities.
Data Analytics Tools Comparison: The 3 Gartner Leaders
In their 2023 report, Gartner Magic Quadrant for Analytics & BI, Gartner named only three vendors as Leaders: Qlik, Power BI and Tableau. That’s because the best data analysis tools include software and SaaS applications that bring together and process data from a wide variety of sources into a single platform that supports a variety of use cases for users of all skill levels, such as data visualization, embedded analytics and augmented analytics.
Compare Power BI vs Tableau vs Qlik on key capabilities across four key categories:
1. Infrastructure & Data Management
Modern data analytics tools should allow you to deploy in any environment and should support an agile, IT-enabled workflow where all data and analytic content use data management capabilities which are self-contained in the platform. Here we compare the tools on four key capabilities.
Cloud Options
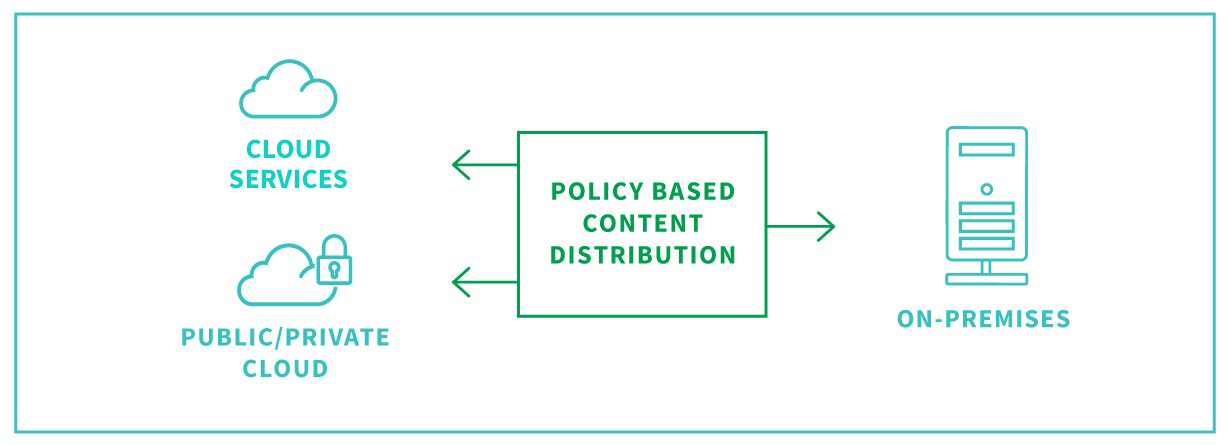
The best data analytics tools have a platform-agnostic, multi-cloud architecture that enables you to deploy in any environment. They should not require that you build new infrastructure, limit your cloud analytics strategy options or lock in your data.
-
Qlik Sense
Qlik provides a full enterprise SaaS solution and on-premise or private cloud options. And, Qlik is an independent company, which means you have complete control of your data.
-
Power BI
Microsoft’s Power BI only gives you one cloud option: Microsoft’s cloud solution, Azure. Further, Power BI's cloud experience is different from their on-premise functionality.
-
Tableau
Salesforce now owns Tableau. It’s unclear what this means for Tableau customers’ data... where it could end up and whether it could get locked in.

Data Integration
Today’s data analysis tools must be a holistic platform. This platform begins with enterprise data integration to make all data accessible to all users and a business-ready data catalog that helps all users find this data.
-
Qlik Sense
Qlik Sense has best-in-class Data Integration capabilities for combining and transforming data as well as data cataloging. Qlik also offers an enterprise class Data Integration platform which provides a seamless analytics data pipeline.
-
Power BI
Power BI’s platform is a patchwork of offerings. To achieve any data integration you’re required to purchase and add Microsoft stack products.
-
Tableau
Tableau Desktop and Tableau Prep both have data prep capabilities. But each solves different problems and neither can solve all. So which should you use? And what do you do about the data problems Tableau can’t solve?
Scalability
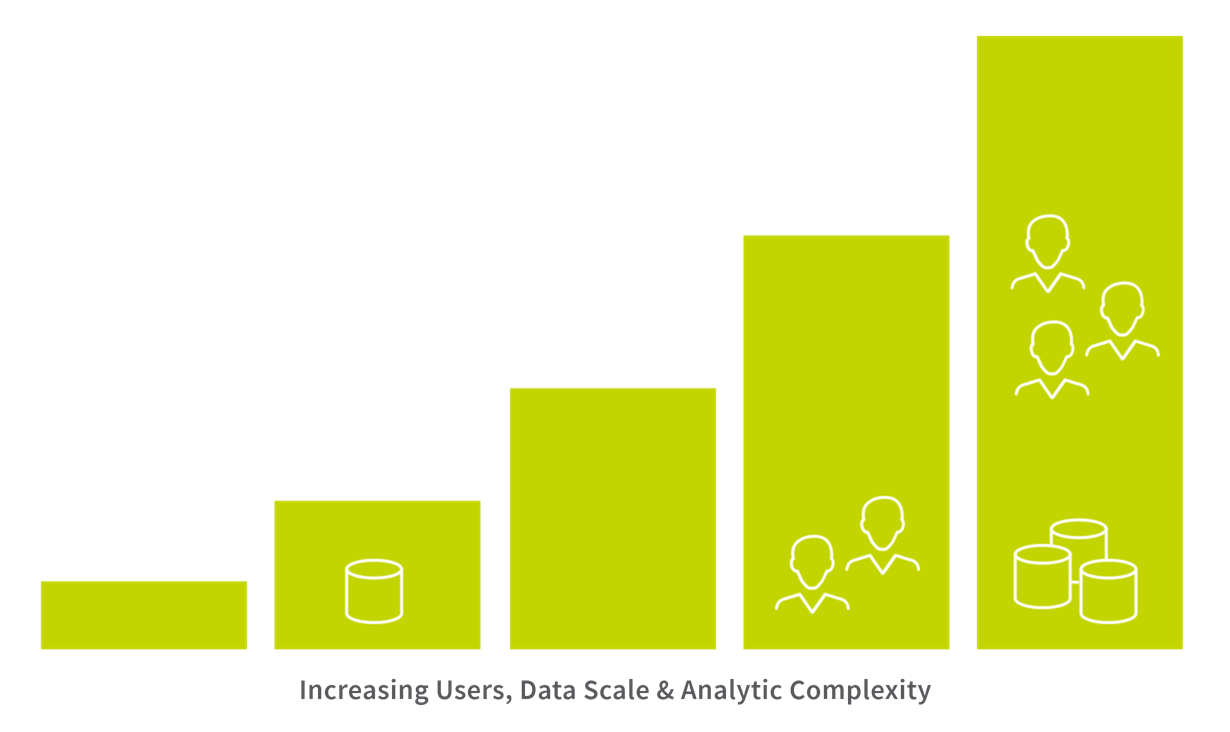
Uncovering insights works best when users have a complete, up-to-date view of all relevant data. This requires big data analytics tools to integrate and combine data from any source, as close to real-time as possible. To do that successfully, you need data analysis software that’s built to handle data at any scale without compromising performance or driving up costs.
-
Qlik Sense
Qlik can ingest billions of rows of data from an unlimited number of sources with complex schemas with dozens of dimensions – and still deliver answers in seconds. Plus, you can keep data fresher in a much smaller build window thanks to Qlik’s ability to add, modify and remove records.
-
Power BI
Operating at scale becomes very expensive with Power BI. Power BI Pro has shockingly low data limits of 1GB per data set. This requires you to use live query, (which will slow your work to a crawl) or pay more and upgrade to Premium.
-
Tableau
Tableau’s engine slows to a crawl when it attempts to handle large volumes of disparate data, especially when paired with complex analytics. And it’s not possible to increment data and keep it fresh in small build windows.

Governed Self-Service
You want to be able to trust your data. But you also want self-service analytics where all users can generate insights without help from IT or an analyst. That’s why top data analytics tools should enable you to securely administer your data with a centralized management capability that uses rules-based governance to control publishing, sharing and user access to apps and data.
-
Qlik Sense
All content creation on Qlik happens in the cloud, where it’s governed and controlled. Plus, governed libraries provide reuse and standardization for analytics. In this way, Qlik unifies and centralizes your data, creating a single, updated, reliable source everyone can trust.
-
Power BI
Power BI decentralizes data, spreading it across users desktops and the cloud. This makes managing and validating data especially challenging.
-
Tableau
Tableau allows for multiple copies of content which means you will have to invest time and money to manage these different copies.
Analytics & BI Tools Comparison Kit
Essential resources for selecting the best tool for your organization, including an evaluation checklist, a TCO comparison report and analyst findings.
2. Data Analysis
As stated above, dashboards and data visualizations are basic expectations for modern data analysis software. The best data analysis software goes beyond, offering any user the ability to freely explore data and to do it with the help of advanced AI and from any device.
Dashboard Data Exploration
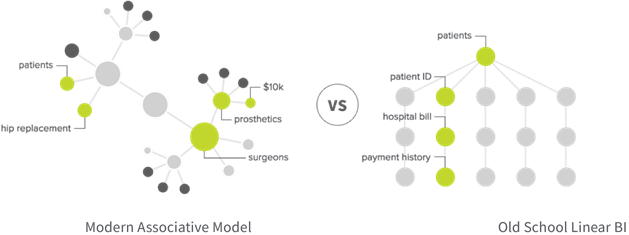
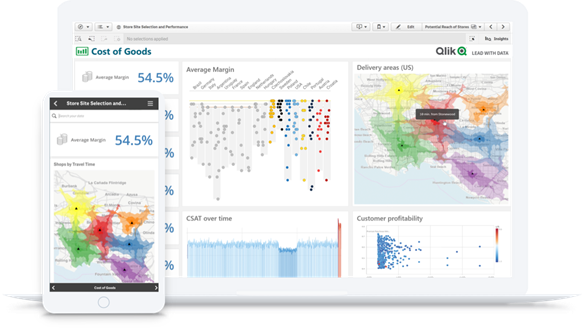
The heart of all data analytics tools is the data engine. The old school, query-based approach limits the data you can explore so it limits the discoveries you make. A modern approach combines an unlimited number of data sources and lets you freely explore them all, directly from within the dashboard. This lets you uncover connections you might not have queried or just couldn’t find at all with a query-based data analysis tool.
-
Qlik Sense
Qlik’s data engine is “associative” in that it lets users explore all data freely, on the fly, and from any angle. Plus, machine learning allows Qlik’s cognitive engine to get smarter over time – giving you ideas of where to explore.
-
Power BI
Power BI works on a SQL database that restricts users to linear, predetermined query paths.
-
Tableau
Tableau also operates over an SQL database that restricts users to following specific (and predetermined) paths within a narrow slide of data. In any given query, only part of your data is analyzed, leaving key patterns and connections undiscovered.
Interactive Data Visualizations
Many data analytics tools allow you to create graphs, charts and maps. Modern tools go beyond, using AI to automatically suggest new visuals, reveal the shape of your data and pinpoint outliers. And the best tools allow you to explore all your data, in any direction, from within the visualization itself.
-
Qlik Sense
Qlik provides the full range of interactive visualizations and includes AI assistance that helps with chart creation, recommended associations, revealing the shape of your data and even data preparation. Plus, you can explore all your data from any direction.
-
Power BI
Power BI also offers a full set of visualizations. These visualizations are interactive but you’ll be limited in filtering and data exploration by whatever query paths were preselected by the author.
-
Tableau
Tableau offers a full range of visualizations as well. After all, this is what Tableau is best known for. But as with their dashboards, you’ll only be able to filter and explore the visualization based on whatever query paths the author selected.
Augmented Analytics
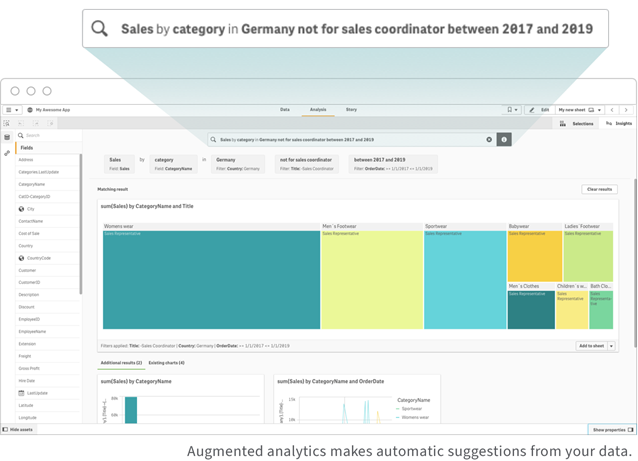
Augmented analytics leverages the scale and speed of machine intelligence to amplify the power of human intelligence to provide better insights, faster. The best data analysis tools offer self-service intelligent alerting and advanced statistical trending and outlier evaluation that immediately notifies users of material changes in the data.
-
Qlik Sense
Qlik allows users to ask any question in natural language and get robust answers. And, as you explore your data, Qlik automatically suggests insights and new connections to explore.
-
Power BI
Power BI added AI with two features, Quick insights and Q&A. Quick Insights provides shortcuts to analyze anomalies in your data. Q&A brings natural language capabilities to the tool.
-
Tableau
Tableau’s Ask Data feature cannot access workbooks, so it doesn’t work with the business logic built into workbooks. It also only connects to data sources, which means it can’t leverage the insight your analysts have built.

Mobility
Top data analytics tools should provide a fully functional mobile app that allows you to deeply explore data and gain insights wherever you are and on any device.
-
Qlik Sense
Responsive design and touch are native to the platform, so Qlik is able to offer a fully functional mobile app. This means you’re able to perform all the same functions on desktop, laptop, phone or tablet – wherever you are, even offline.
-
Power BI
Desktops rule for Power BI. You need a variety of desktop software to perform different tasks and Power BI’s cloud is mainly used for uploading reports, which have fewer editing capabilities.
-
Tableau
Tableau mobile only allows you to download one sheet from a broader workbook. And you can’t filter; you can only highlight one value at a time and scroll to see where that value shows up in related charts.
Modern Analytics Demo Videos
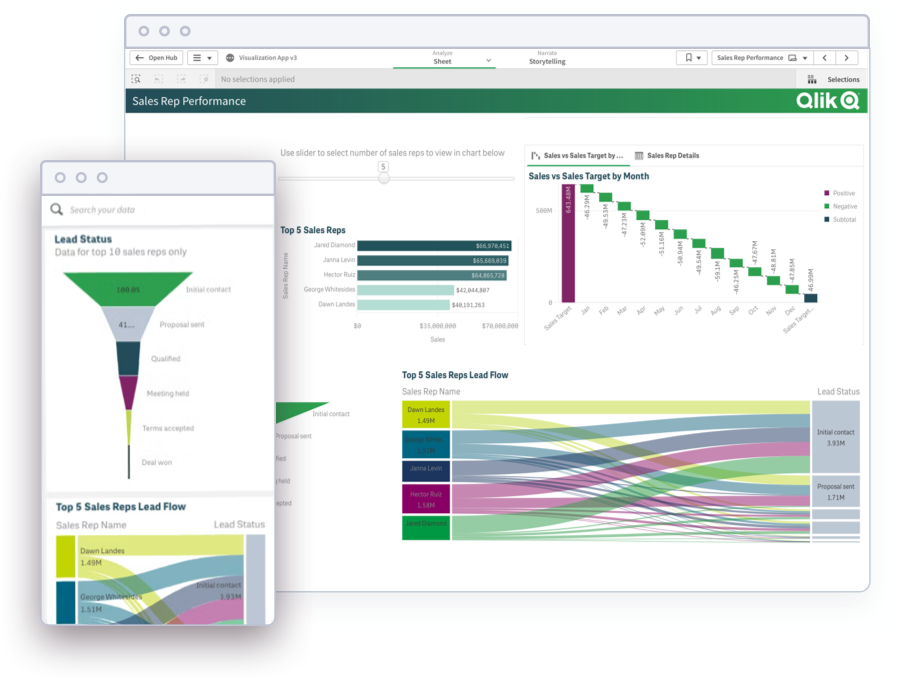
See how to explore information and quickly gain insights.
- Combine data from all your sources
- Dig into KPI visualizations and dashboards
- Get AI-generated insights
3. Ease Of Use
Advanced analytics capabilities are only useful if they’re actually used. The best data analysis software should make it easy for anyone to explore data, create interactive dashboards and visualizations, and get data-driven insights in minutes. Three key factors that bring ease of use are:
- Embedded Analytics: Putting full analysis capabilities within the apps and workflows people regularly use.
- Broad Use Cases: Being able to perform all data analysis use cases using the same interface, on any device.
- Data Literacy: A blend of training, processes and technology that ensures a data-driven culture.
Embedded Analytics
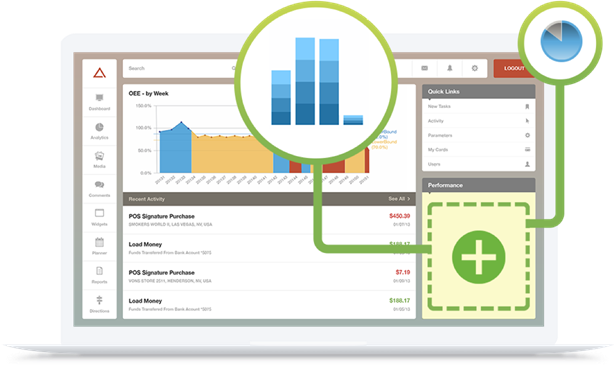
Embedded analytics, also known as OEM or white label analytics, puts actionable analytics and data within other applications, portals and processes. This allows employees, suppliers, partners and customers to explore data within their current workflow and thereby make better decisions faster. Big data analytics tools should provide open API’s and an extensible platform to embed full analytics capabilities across your entire enterprise ecosystem.
-
Qlik Sense
Qlik makes it easy to embed a dashboard, including individual numbers, values, and metrics in your products, workflows, portals, and edge devices. Qlik’s API-first platform works with the latest web and application technologies.
-
Power BI
Power BI allows for embedding dashboards and other objects, but Power BI is not API-first and many capabilities are not available in their software development kits.
-
Tableau
Tableau’s APIs are notoriously limited. For example, it only allows you to embed an entire dashboard, not the individual numbers, values, and metrics.
Broad Use Cases
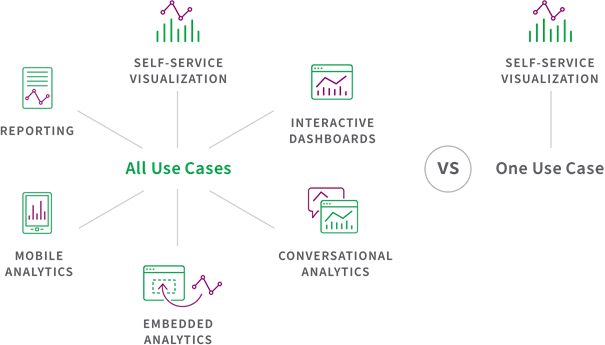
A modern data analytics platform should support the full range of analytics use cases --like exploring data, embedding analytics, or creating interactive dashboards--for all types of users, such as analysts, engineers and businesspeople. Your tool should allow all users to carry out all data analytics use cases using the same platform and data.
-
Qlik Sense
All users in your organization perform all activities on the same platform with a common analytics engine, AI capabilities and analytics data pipeline.
-
Power BI
Microsoft requires users to use multiple products to deliver on a range of use cases.
-
Tableau
Tableau really only has one use case (data visualization). Plus, you’ll need skilled business authors who know the rules of databases and SQL to create these visualizations.

Data Literacy
Most big data analytics tools will educate users on how to use their product. The best tools help all levels of users learn how to become data literate, empowering them to work with, analyze and communicate with data.
-
Qlik Sense
Qlik is geared for self-service, letting anyone, at any skill level, explore their data. For example, users can drag-and-drop to create reports with ease. Qlik also offers data literacy as a service which blends training, processes and technology.
-
Power BI
Only authors have self-service access in Power BI. And, once content is published, it only allows for very limited interactivity. Users need to go back to the author if they want to explore deeper.
-
Tableau
Only authors can make discoveries in Tableau. That’s why their data literacy initiative is focused on authors. Which feels more like data dictatorship than data democracy.
4. Total Cost of Ownership
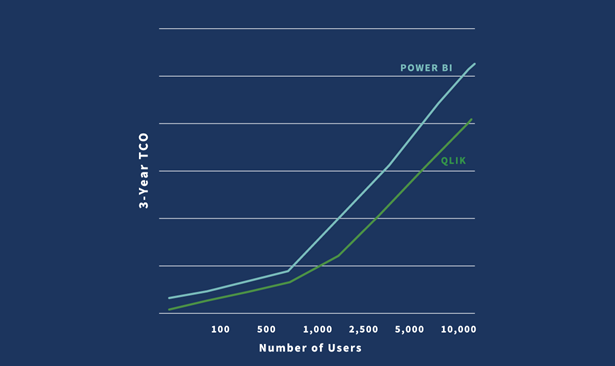
Total cost of ownership (TCO) goes beyond the cost of the software to include all expenses over a 3 to 5 year period such as infrastructure, systems setup and app development, and systems admin and support. Some data analytics tools companies are more transparent than others regarding the total financial and time commitment required to use their tool.
-
Qlik Sense
Qlik’s TCO is lower than Power BI or Tableau and Qlik provides total transparency on costs. Qlik will not require extra data or compute costs as you grow.
-
Power BI
With Power BI, working at enterprise scale will require you to pay substantial upgrade and add-on fees. Learn more.
-
Tableau
Tableau requires you to create many reports to reproduce what’s contained in a single Qlik app. That takes time, and time is money. Plus, refreshing that content could cost you extra as well.
Analyst Perspectives on Data Analytics Tools
Compare the best data analysis software with these useful resources.
-
BARC’s BI & Analytics Survey 23: Qlik Highlights
BARC, a leading enterprise software analyst firm, talked to real BI users to analyze and compare leading BI and Analytics products. Users ranked Qlik Sense® #1 in Performance Satisfaction, Dashboards, and Project Length in its peer groups. -
Gartner’s Choice for a Magic Quadrant Leader
Find out why Qlik has been named a Leader in the Gartner Magic Quadrant for Business Intelligence and Analytics Platforms the 13th year in a row.
-
BI Tools Comparison Kit
This kit provides essential resources for selecting the best BI tool such as an evaluation checklist and a TCO comparison guide.
FAQs
-
Data analytics software is used to find patterns, trends, and relationships in data to help businesses transform their raw data into valuable insights that they can use to make smarter decisions, anticipate risk, and identify critical opportunities. Advanced data analytics software capabilities can be used for more complex use cases including forecasting, simulation, and decision guidance.
-
Businesses use data analytics tools to obtain actionable insight into their business operations, customers, and competitors. For example, analytics tools can be used to optimize staffing schedules and pricing structures, enhance supply chain efficiency, improve the performance of digital marketing campaigns, inform product development, detect fraud, and forecast sales revenue.
-
AI is employed in data analytics tools to help users process and analyze data faster, thereby shortening time to insight. Machine learning is used to automate data preparation and insights discovery while natural language processing is used to make analytics accessible to more types of users. AI-powered data analytics tools enable users to extract insights from large and complex data sets faster by automating mundane and time-consuming tasks and exposing the user to insights they might otherwise miss.

