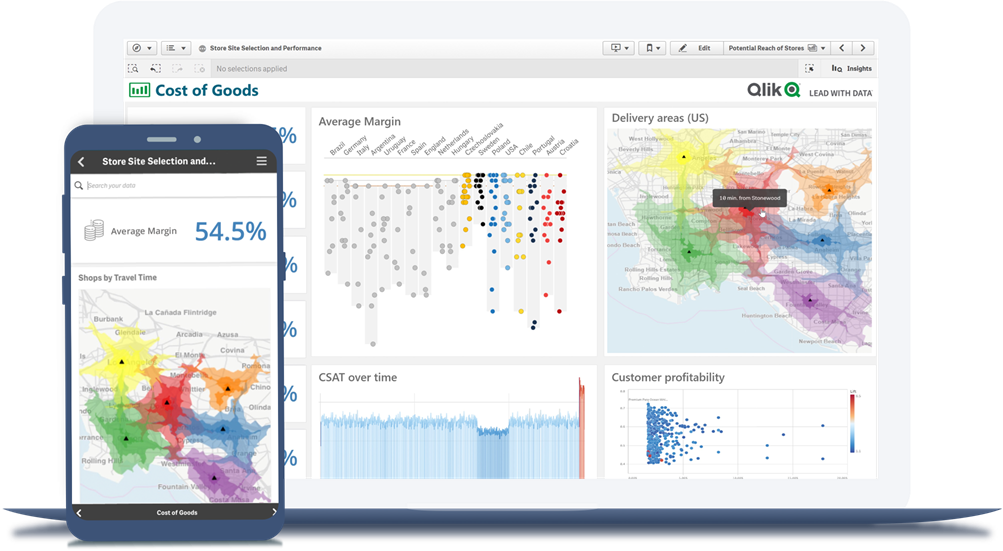
Data Visualization
What it is, why it matters, and best practices. This guide provides practical advice and examples to help you create best-in-class data visualizations of your own.
What is Data Visualization?
Data visualization refers to the representation of data or information in charts, graphs, maps or other visual formats. This makes it easier for stakeholders to see trends, recognize relationships and uncover outliers in their data. With the rise of big data, effective visualization helps transform massive datasets into a clear, compelling story and actionable insights that can increase efficiency, revenue and profits.
How Data Visualization Can Benefit Your Business
Data visualization is more than transforming data into graphical formats. It’s an essential capability within an organization’s business intelligence (BI) strategy. Because when you choose the right visualization to highlight the most important aspects of your data, you can illuminate new insights and communicate them more persuasively. And that can result in smarter actions and bigger outcomes for your business.
- Faster decision-making: By viewing and manipulating large data sets in visual formats, you can understand the story your data tells you at a quick glance, rather than poring over piles of numbers and tables for hours or weeks.
- More data exploration: The best data visualization tools allow users to interact with all their data, directly on the chart to discover hidden patterns, see data relationships and uncover actionable insights — all without IT support.
- Better track business initiatives: Dashboards help people easily track the performance of business initiatives by allowing them to quickly see how everyday operations affect key performance indicators (KPIs).
- Extend your analytics investment: Because visuals make it easier to understand data, everyone in an organization — including business users — can explore data and find insights that improve company growth and effectiveness.
10 Ways to Take Your Visualizations to the Next Level
Data Visualization Types and Examples
Form follows function
Before you choose a visualization type, ask yourself which relationships in your data you want to show. In other words, what’s the function of your chart?
Here we describe and give examples for nine functions of visualizations and the corresponding chart types for each as originally defined by The Financial Times’ Visual Vocabulary. Once you’re clear on the function, you can select a chart type.
9 Functions of Visualizations:
Chart types:
- Area Timeline
- Calendar Heatmap
- Circles Timeline
- Column Timeline
- Column-Line Timeline
- Fan Timeline
- Gantt Chart
- Line Chart
- Scatterplot-Line Timeline
- Seismogram
- Slope Chart
- Stock-price
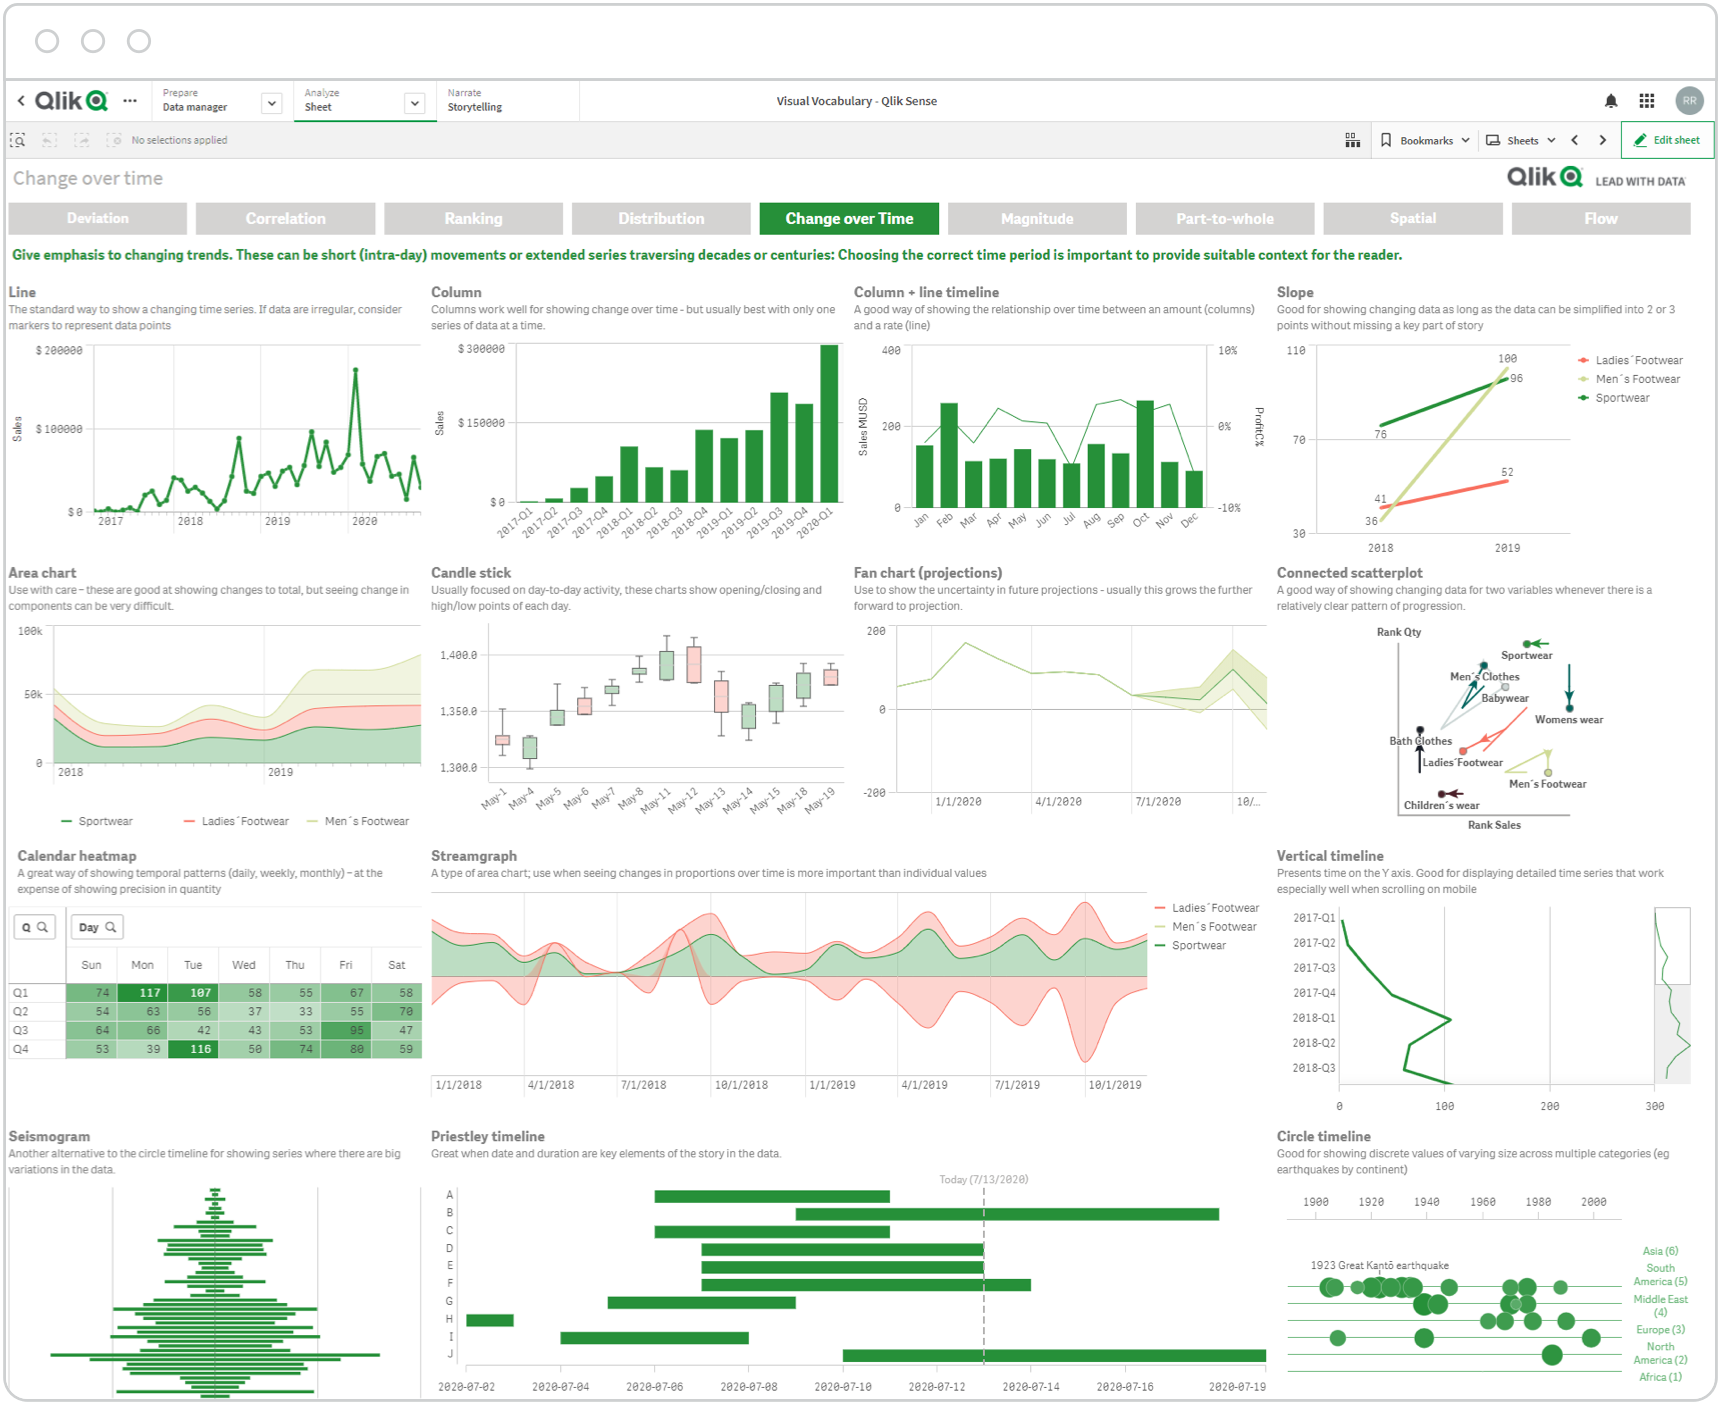
Chart types:
- Barcode
- Boxplot
- Cumulative Curve
- Dot Plot
- Dot Plot Strip
- Histogram
- Population Pyramis
- Violin
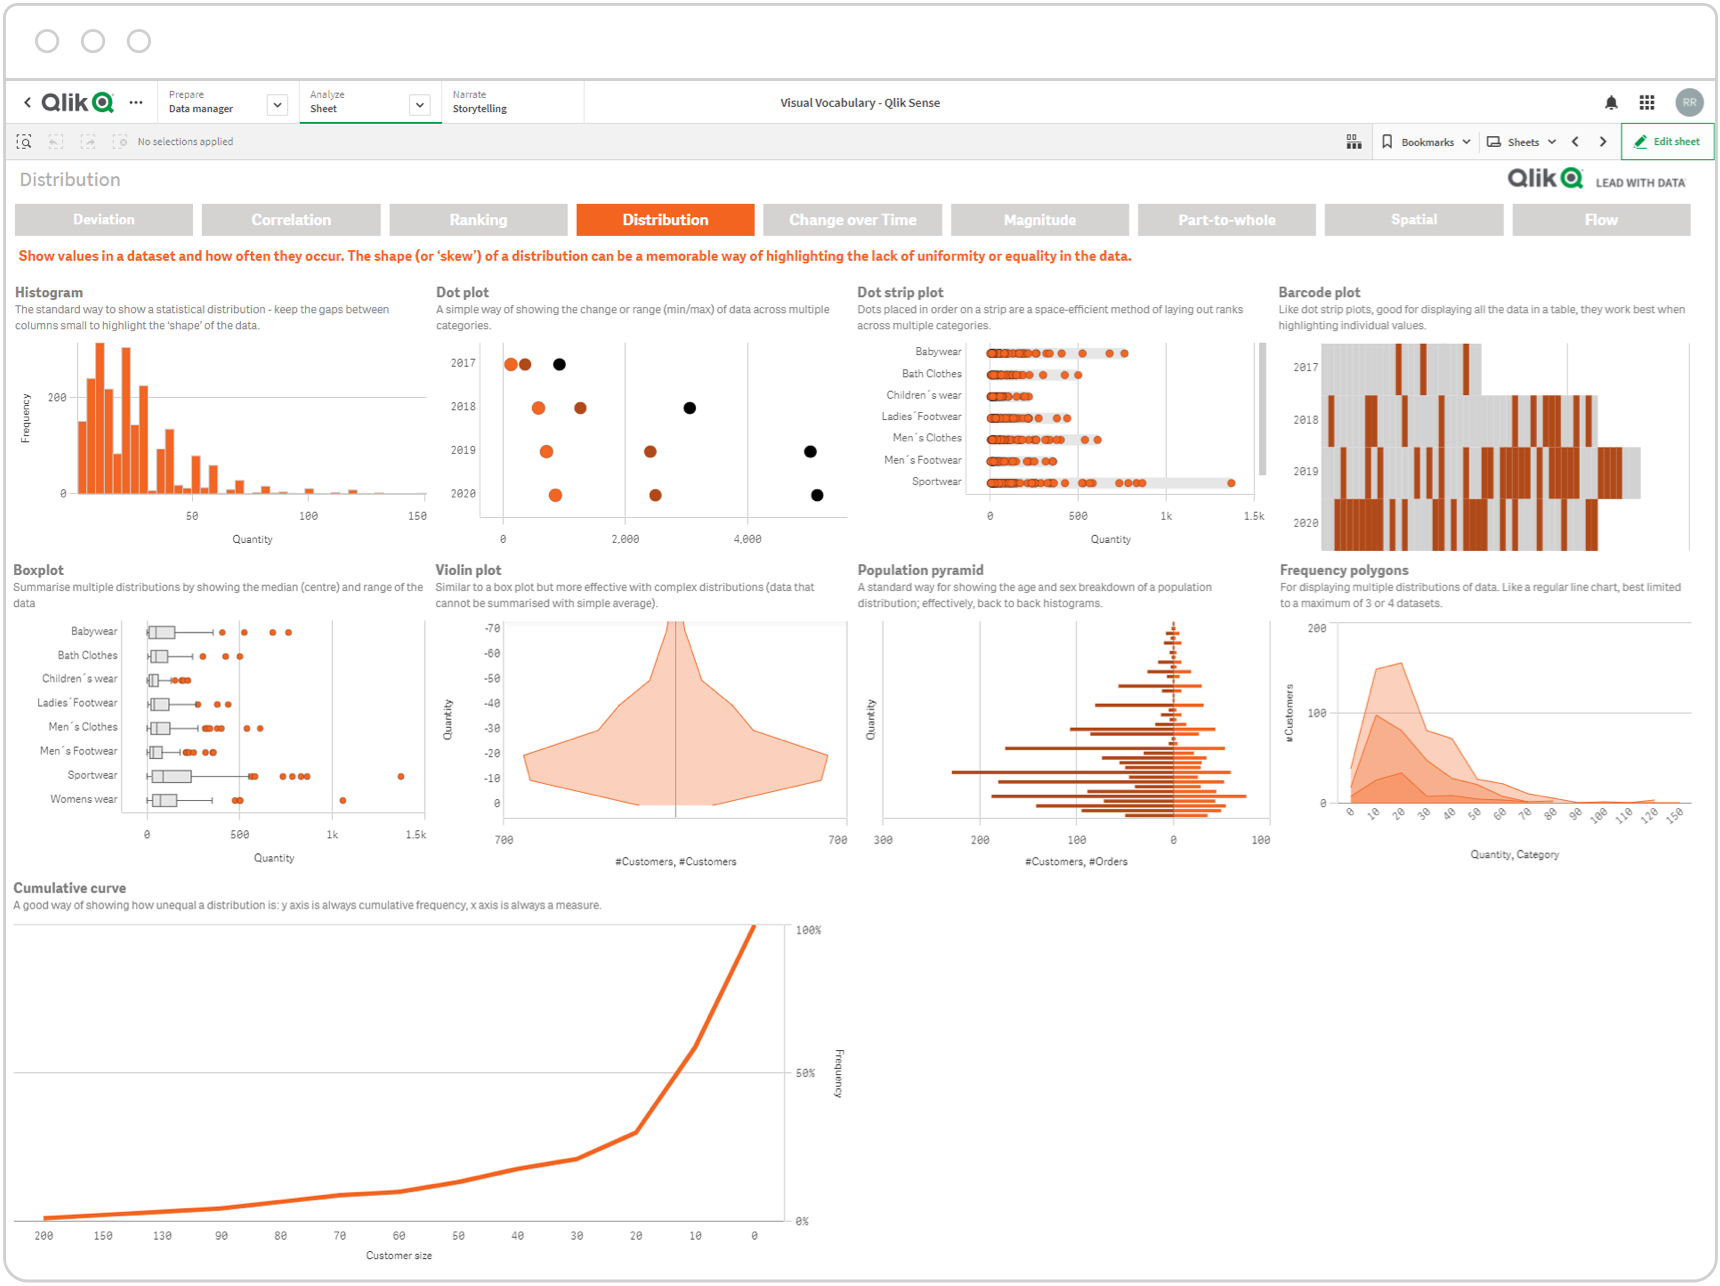
Chart types:
- Arc Chart
- Bar Stacked Proportional
- Donut Chart
- Gridplot
- Pie Chart
- Stacked Column
- Sunburst
- Treemap
- Venn Diagram
- Voronoi
- Waterfall Chart
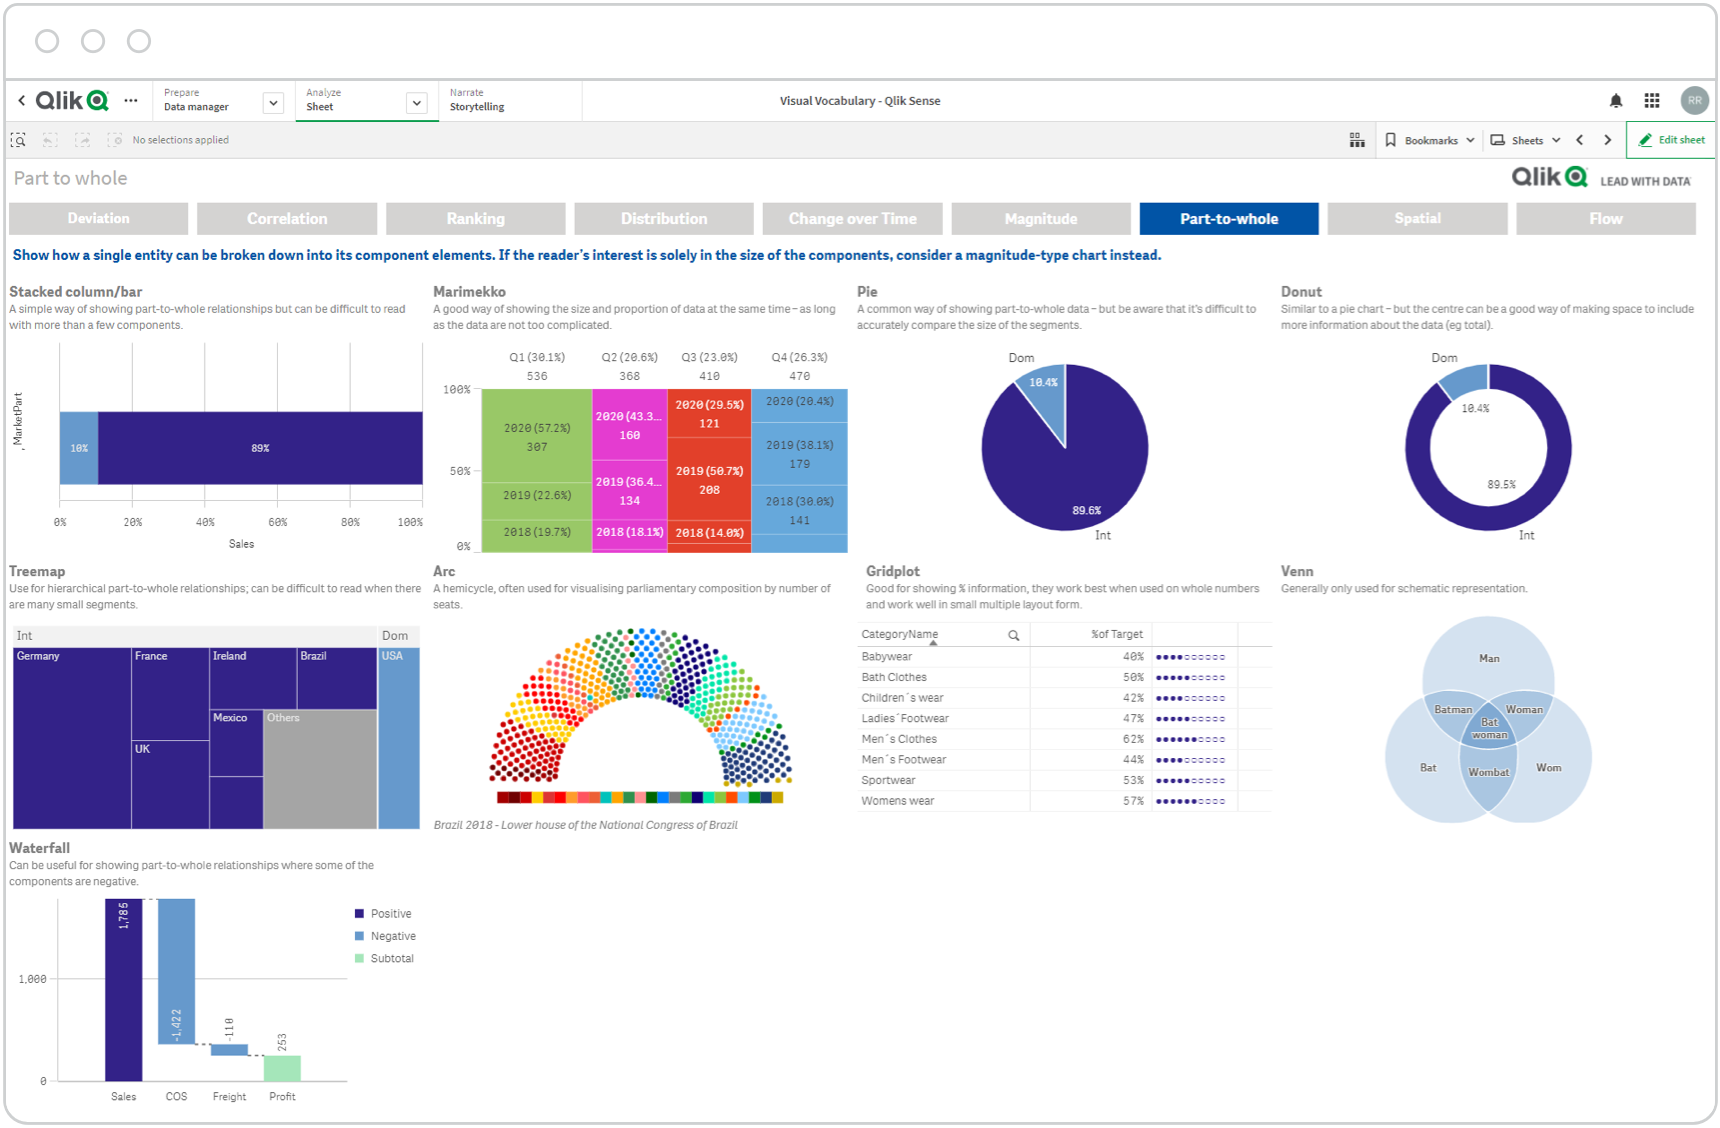
Chart types:
- Bubble Chart
- Line Column
- Scatterplot
- Scatterplot Connected
- XY Heatmap
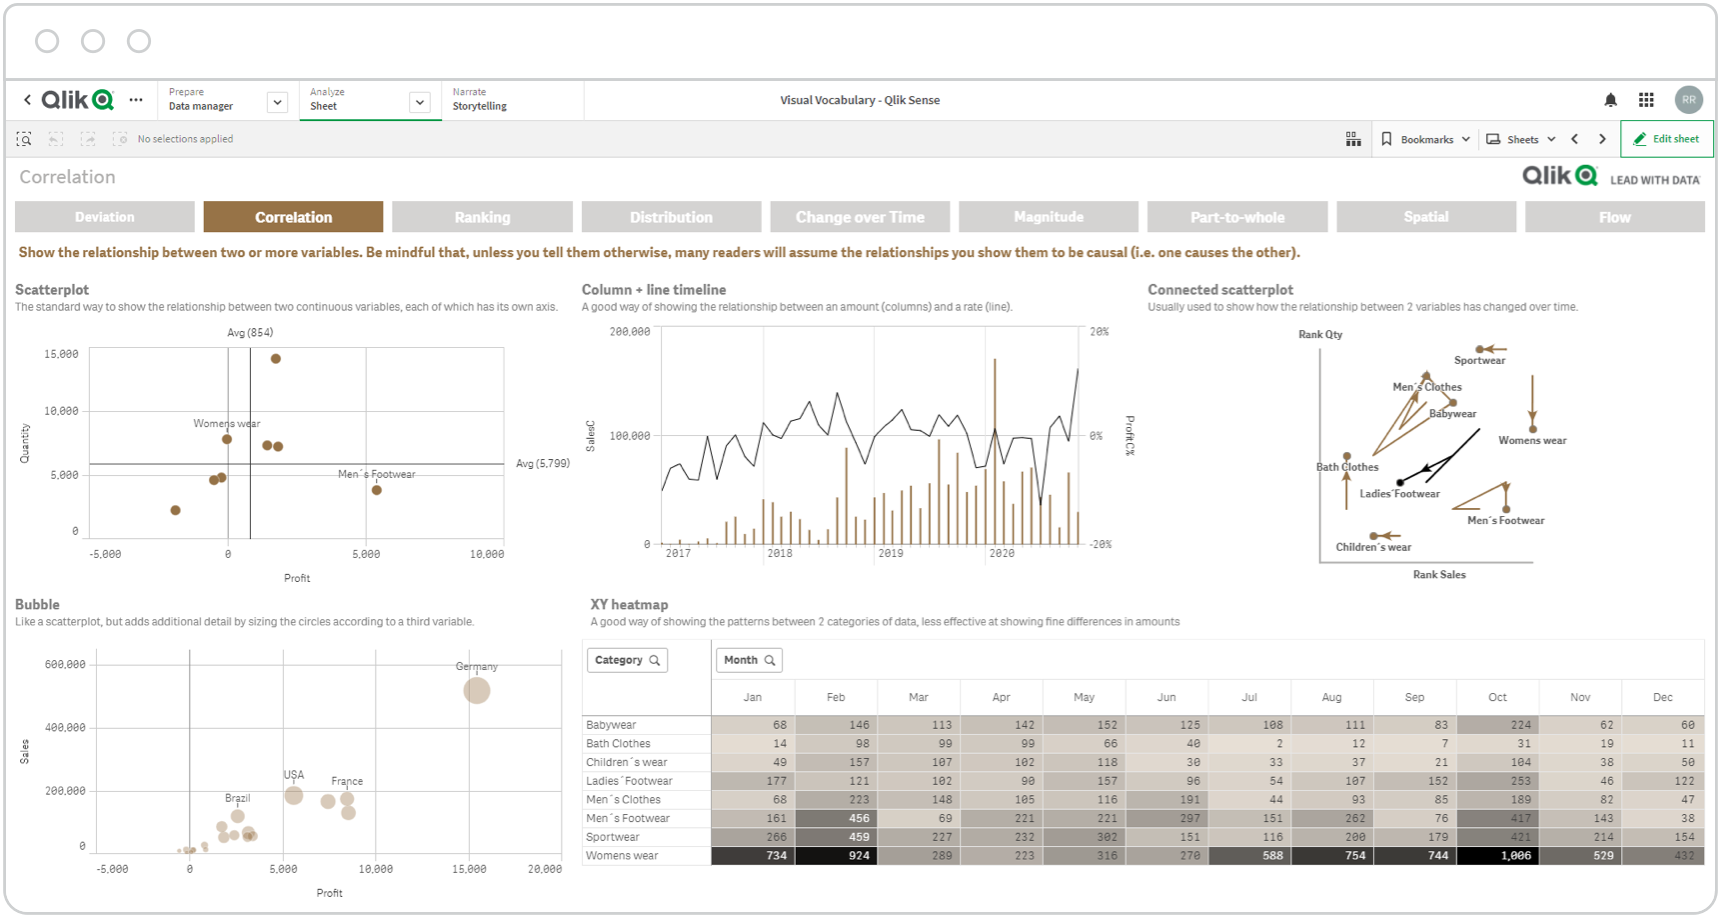
Chart types:
- Chord
- Network
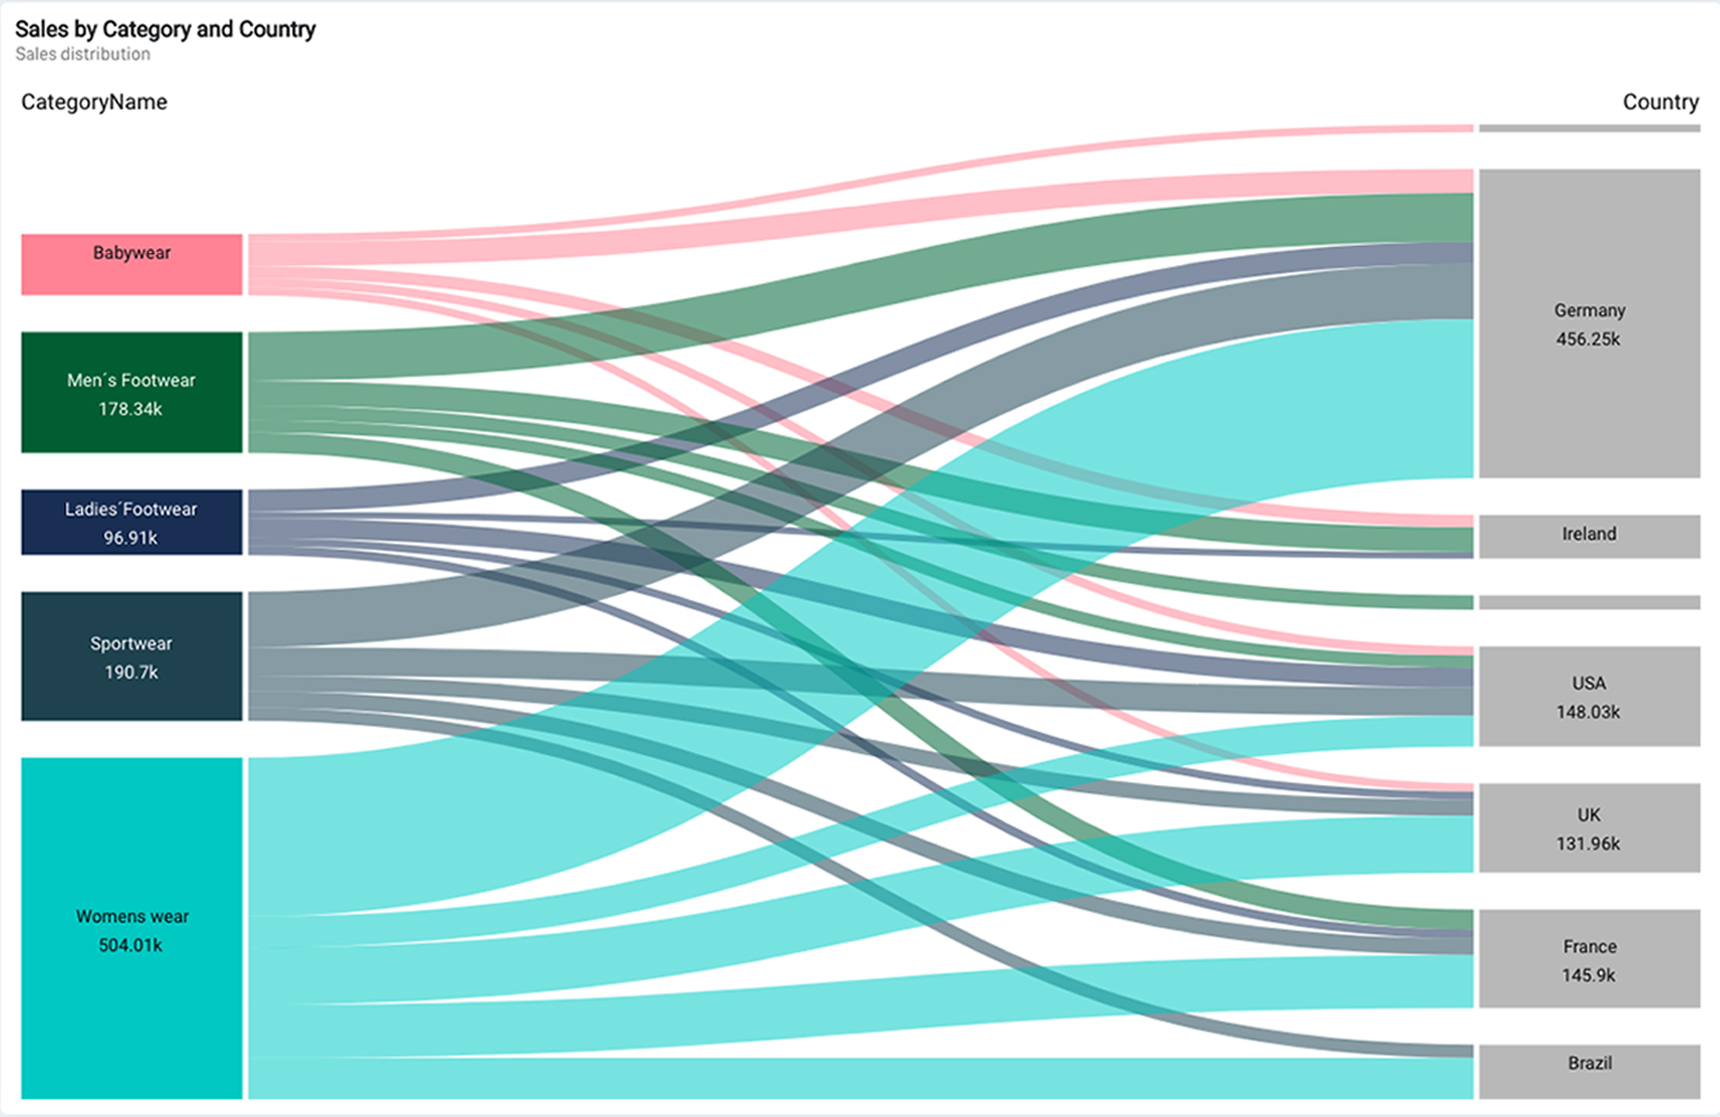
- Sankey
- Waterfall
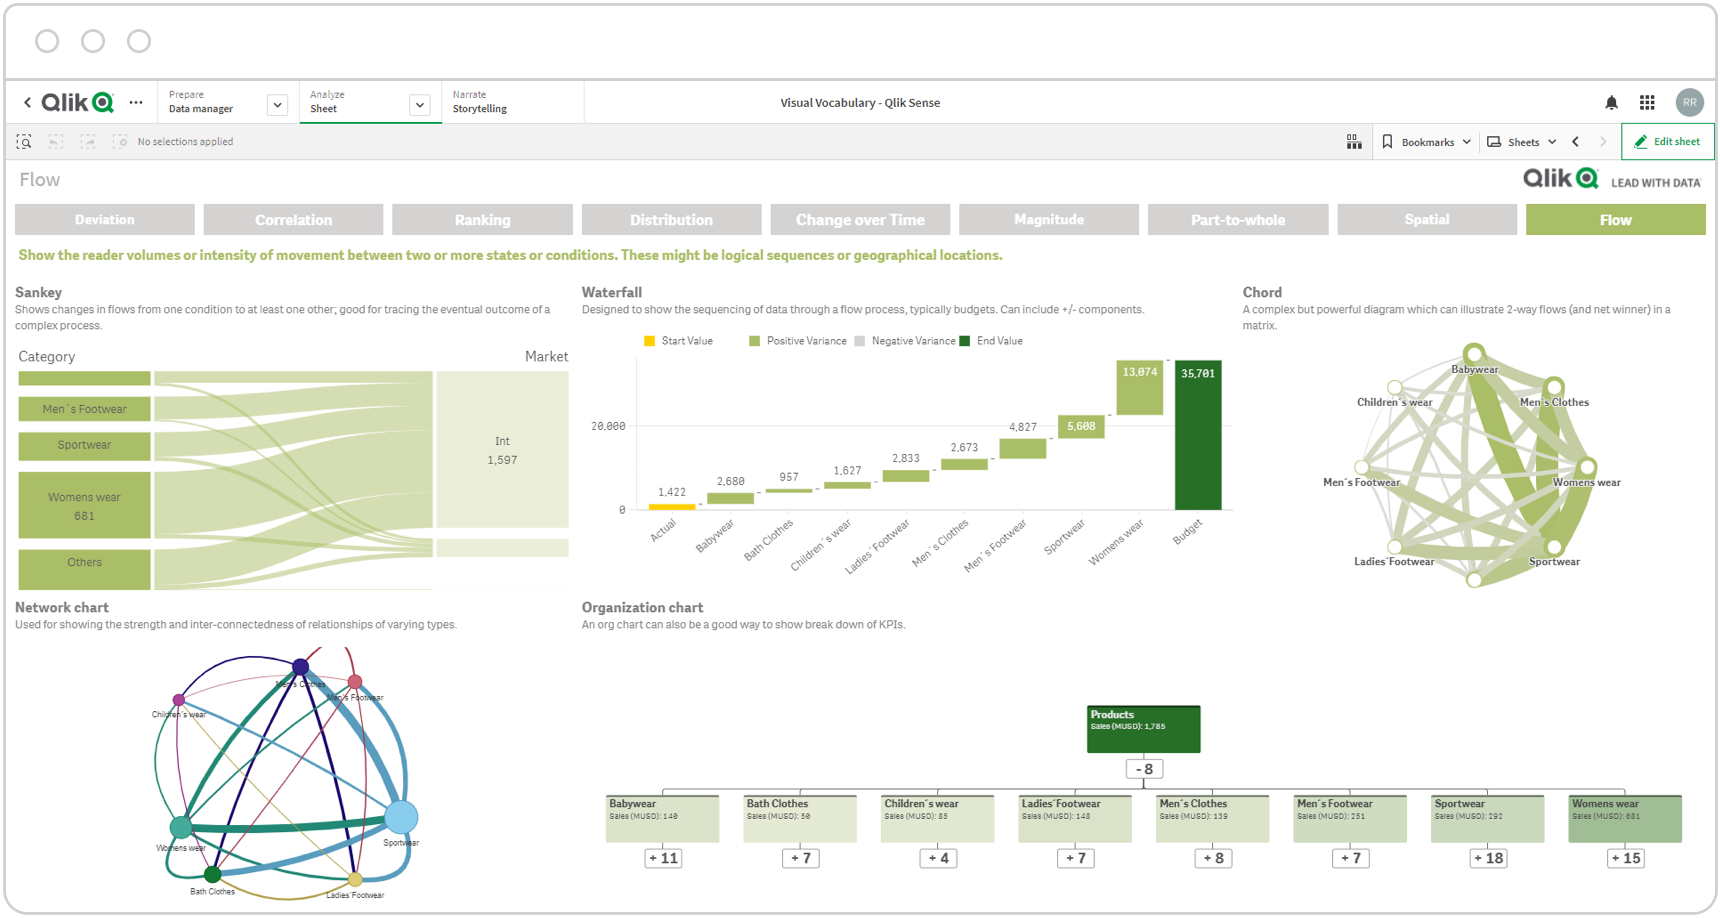
Chart types:
- Bar Ordered
- Bump Chart
- Column Ordered
- Dot Plot Strip
- Lollipop H
- Lollipop V
- Slope Chart
- Symbol Proportional Ordered
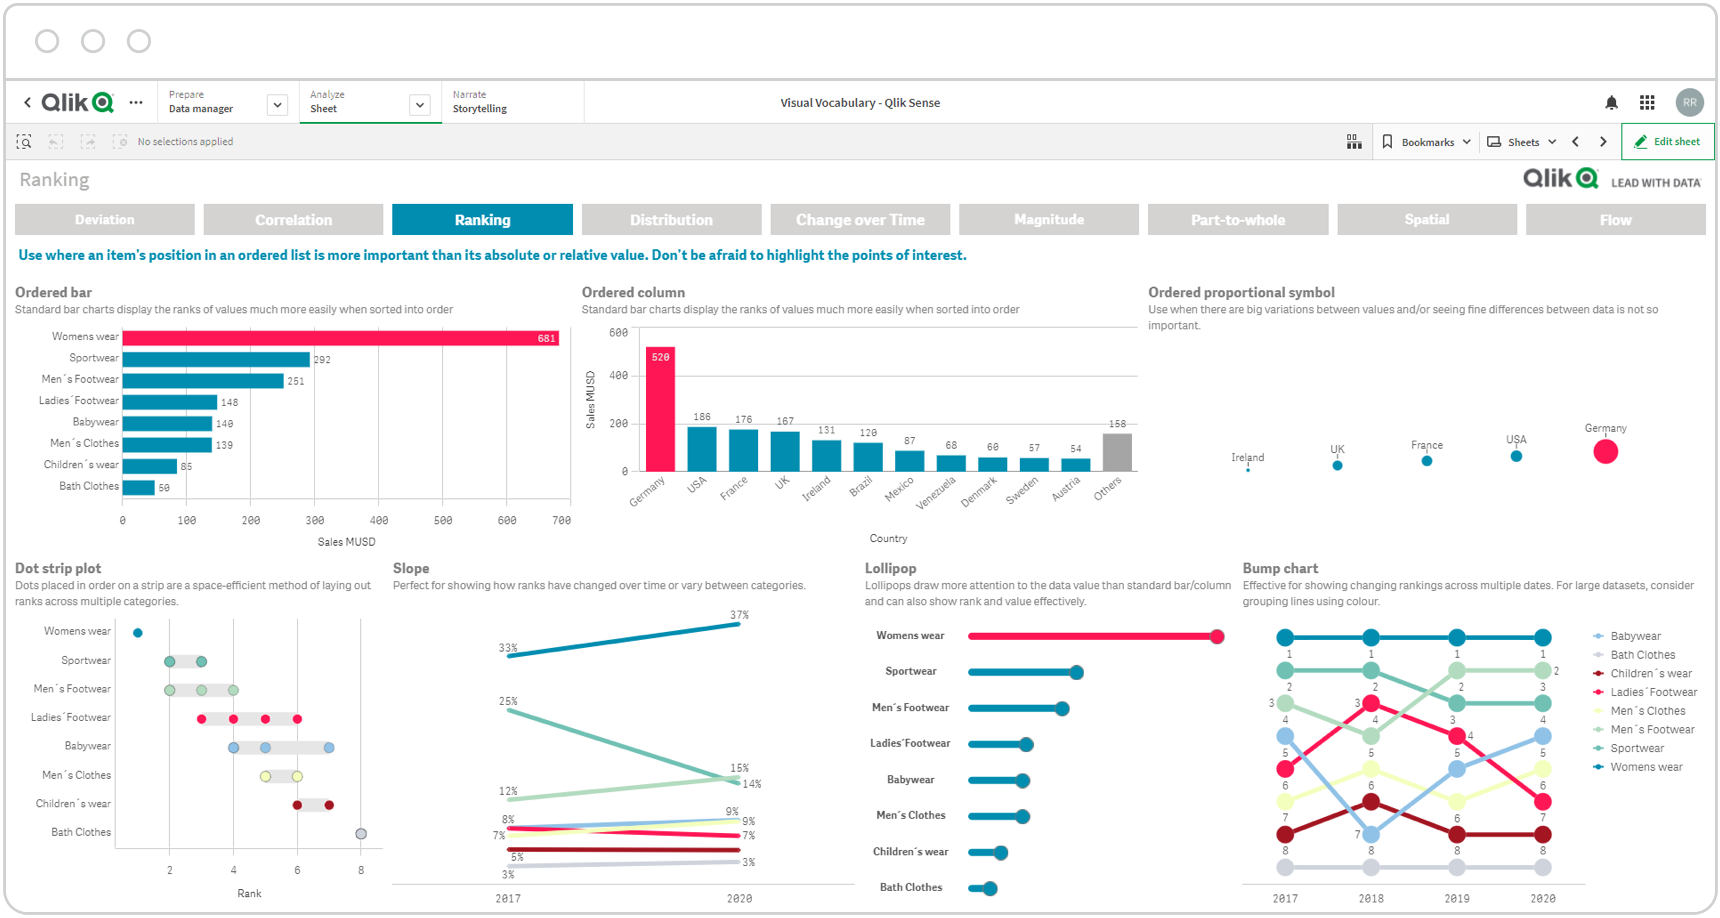
Chart types:
- Bar Diverging
- Bar Diverging Stacked
- Line Surplus/Deficit Filled
- Spine Chart
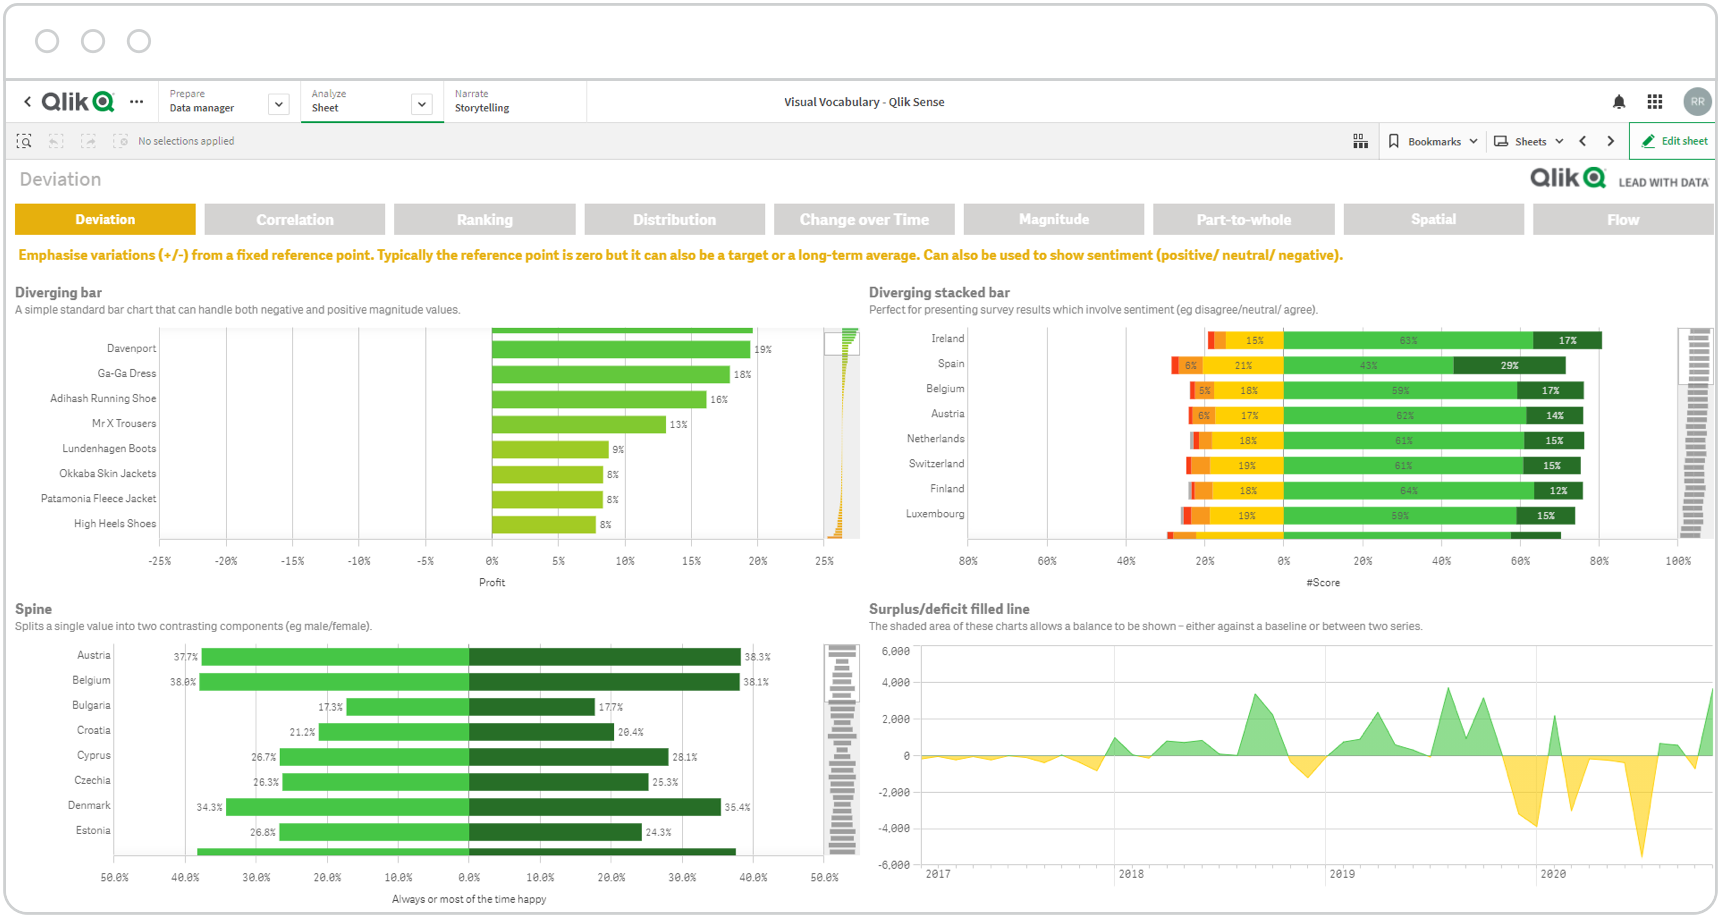
Chart types:
- Bar Chart
- Bar Grouped
- Bar Stacked Proportional
- Bullet Chart
- Column Chart
- Column Grouped
- Isotope (Pictogram)
- Lollipop H
- Lollipop V
- Parallel Coordinates
- Radar Chart
- Symbol Proportional
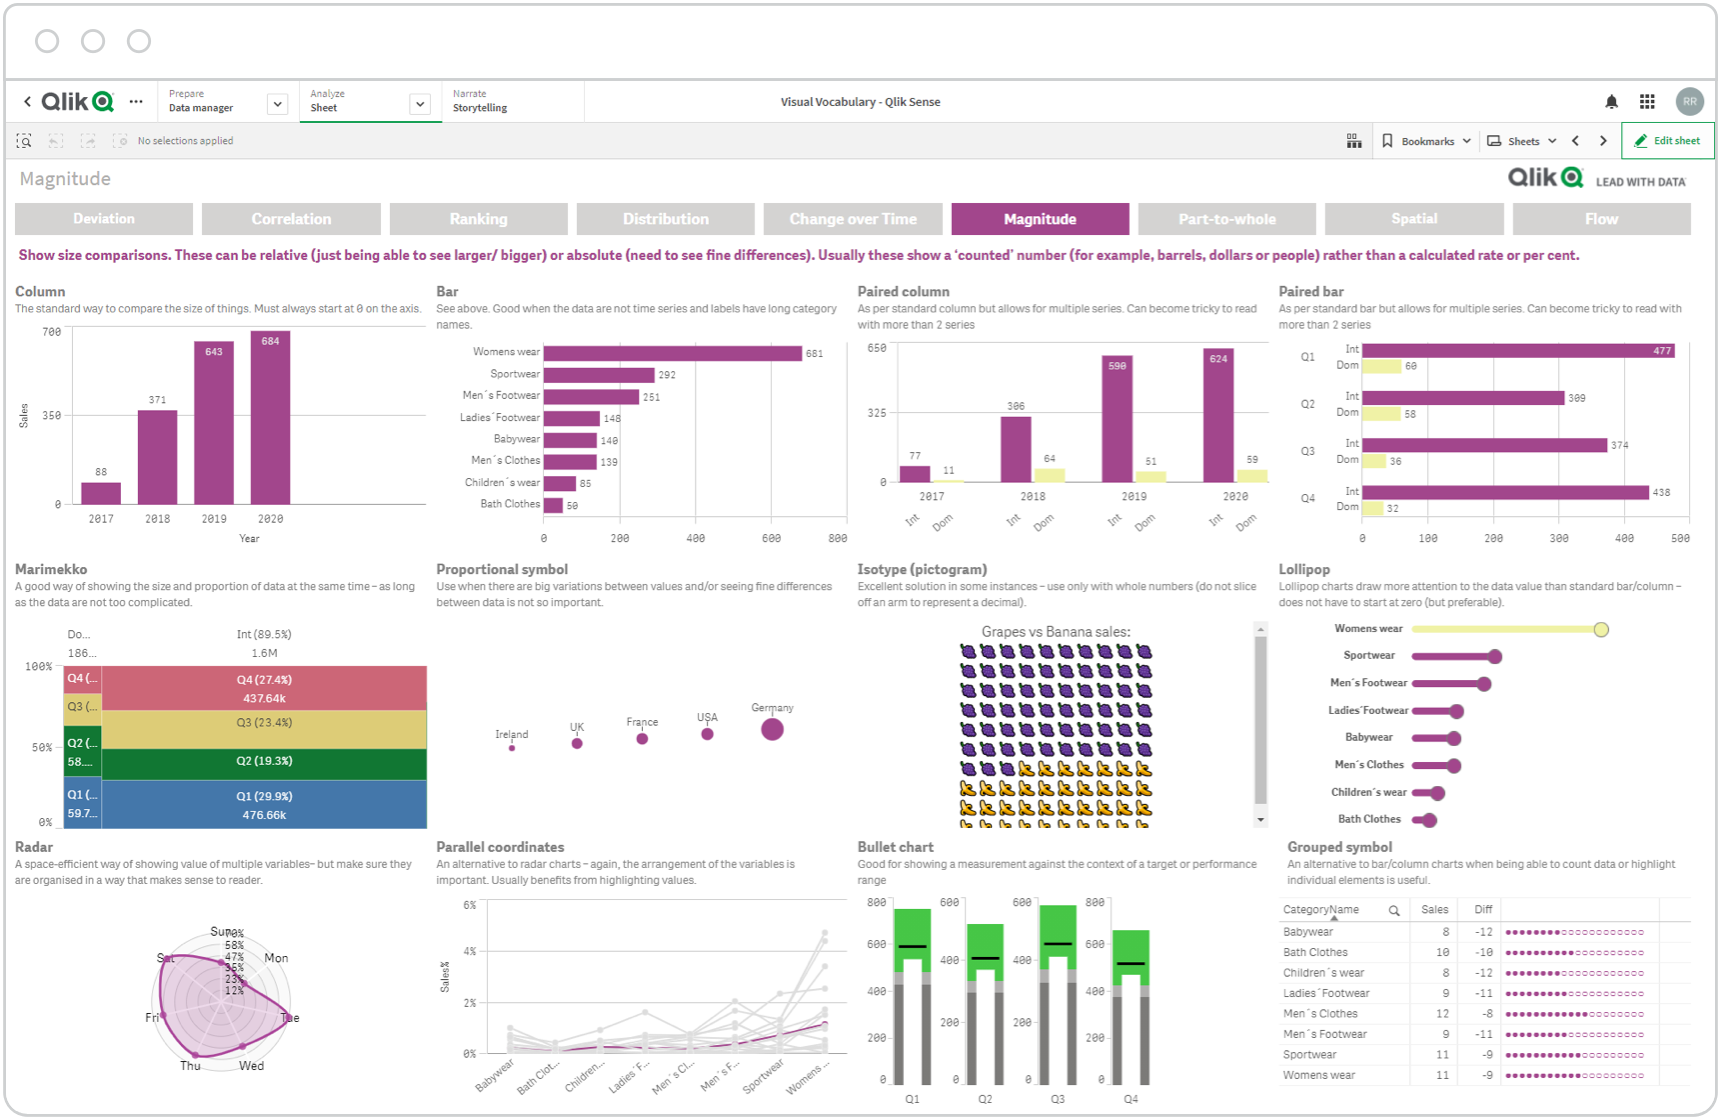
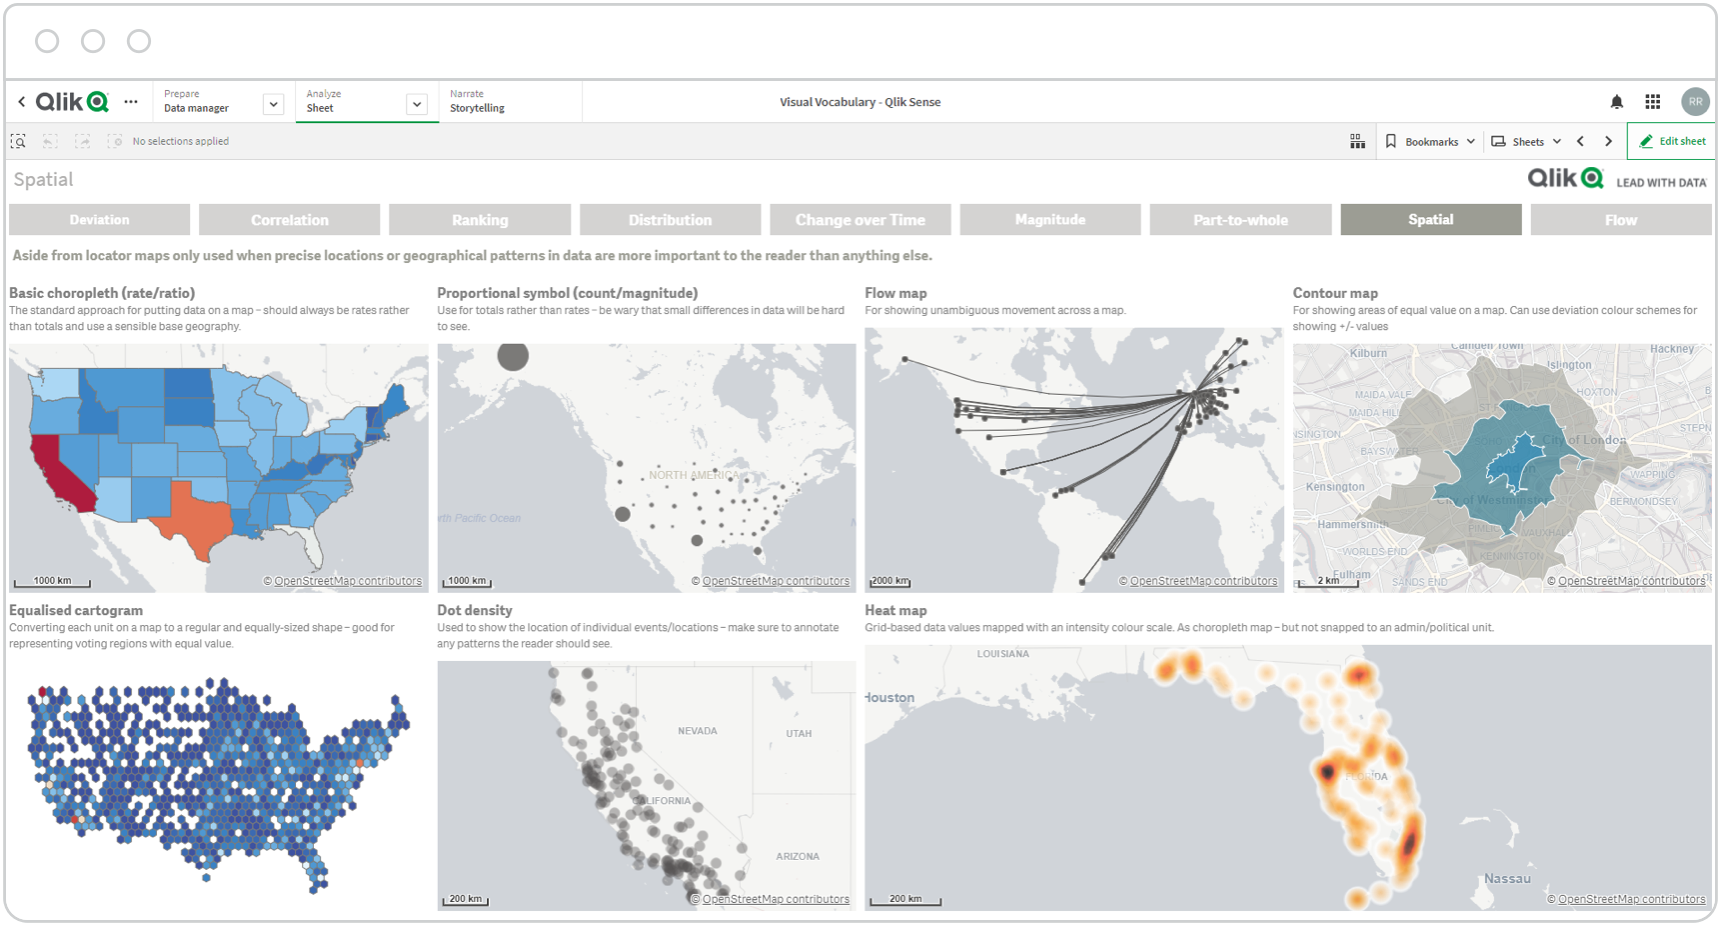
Chart types:
- Basic Choropleth
- Contour Chart
- Dot Density
- Equalised Cartogram
- Flow Chart
- Heatmap
- Scaled Cartogram Value
- Symbol Proportional
Best Practices for Data Visualization
Know your data
Make form follow function
Keep visuals simple
Let users discover freely
Guide users when they need it
Embed data everywhere
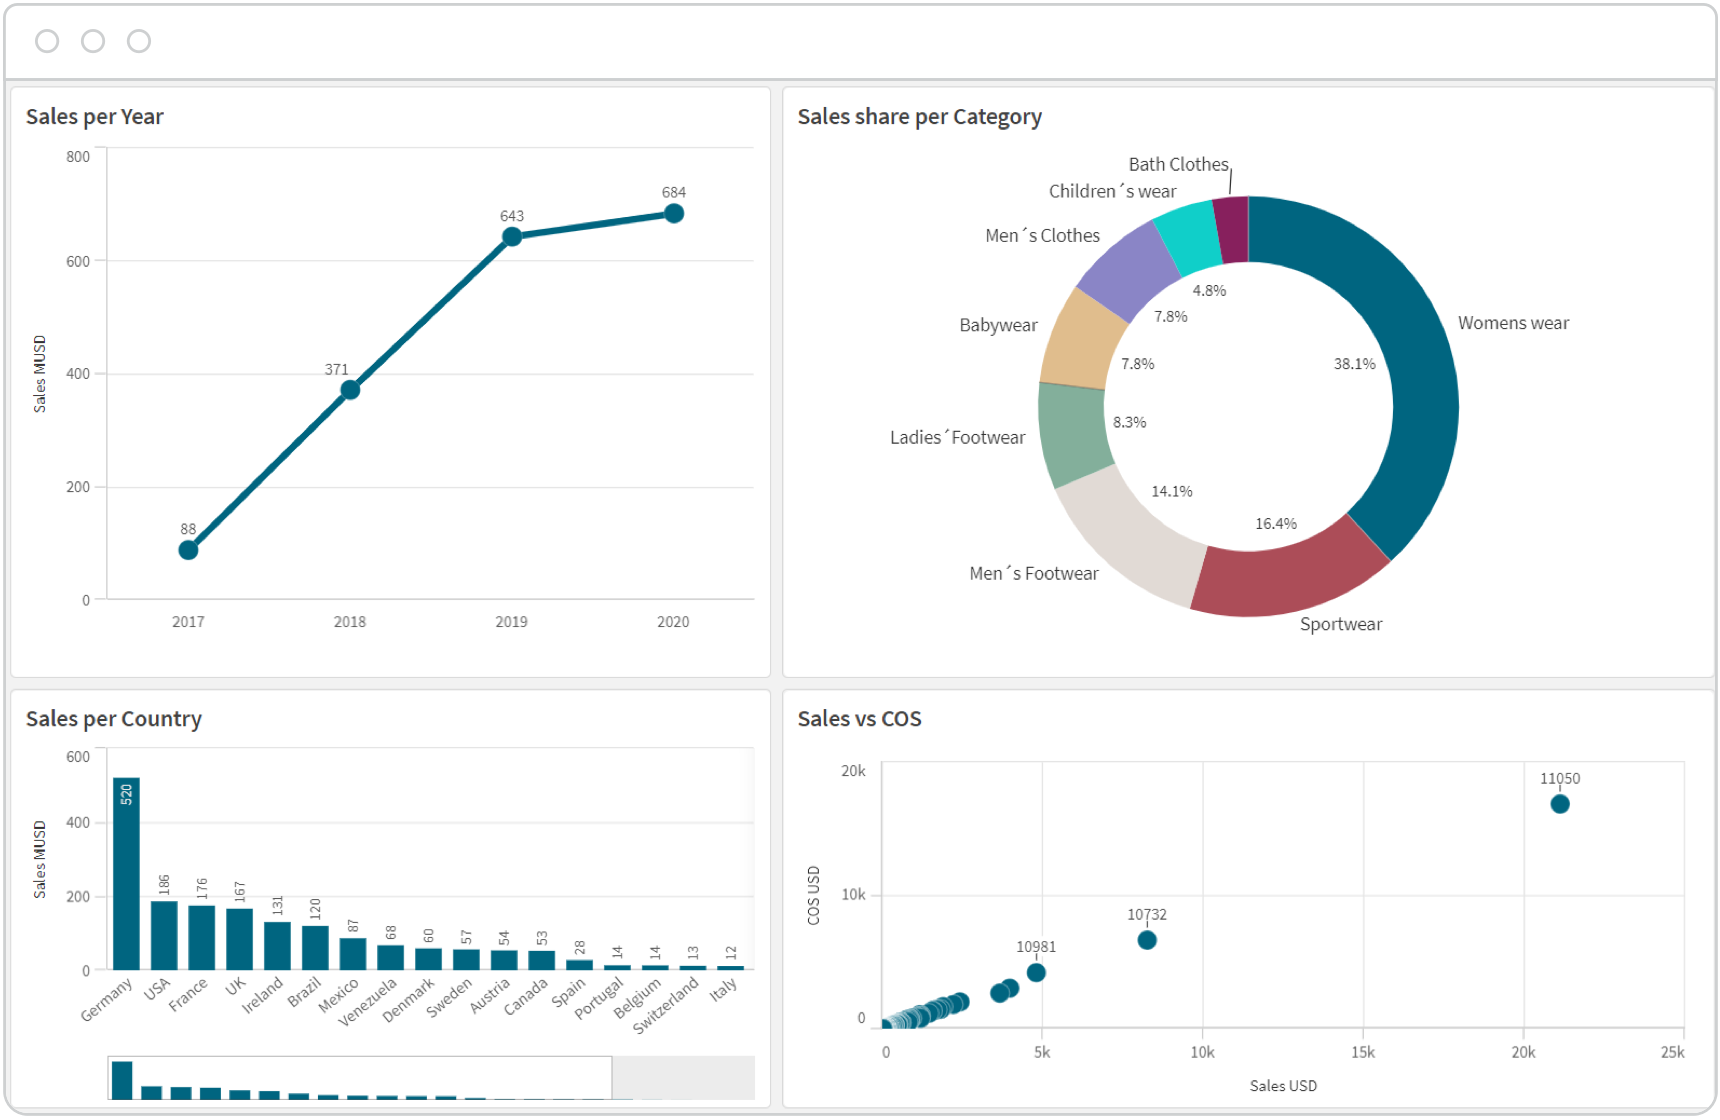
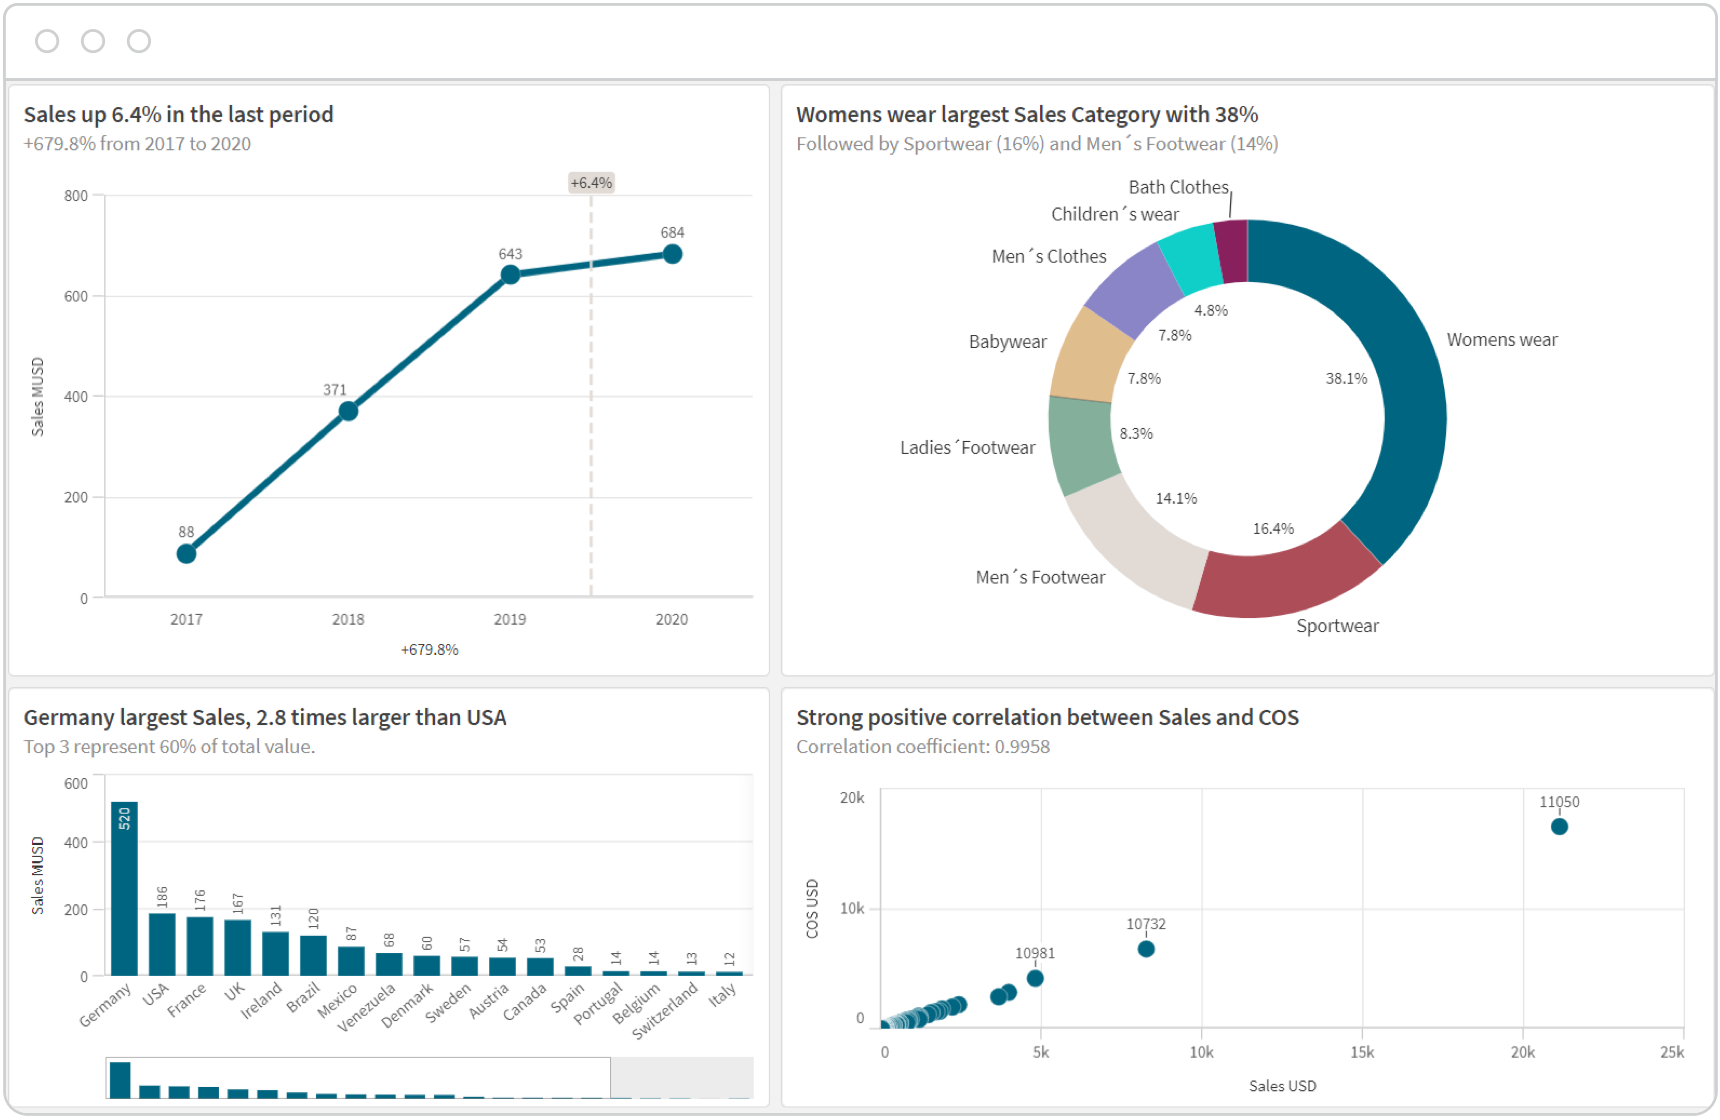
Titles matter.
-
Generic Chart Titles
-
Descriptive Chart Titles
How to Design Best-in-Class Dashboards
Download our ebook with 4 must-see dashboard examples.
Common Data Visualization Challenges
Lack of data understanding
Clutter
Lack of data governance
Reliance on manual processes
Key Capabilities of Data Visualization Tools
Present data in the optimal context
The best tools offer the flexibility to visualize data in the most relevant and intuitive formats and can combine data from multiple sources to give users the full picture.
Facilitate data discovery
Static charts and linear drill-downs stop short of answering user questions about their data. Tools should allow users to freely explore data in whatever direction their intuition leads them.
Suggest visuals with AI
Data analytics tools use augmented intelligence to recommend visualizations that can help even novice users build their own analytics views and discover hidden insights.
Embed anywhere
People need access to visual representations of data and insights no matter which application they’re using. The best tools make it easy to embed analytics wherever people are working.
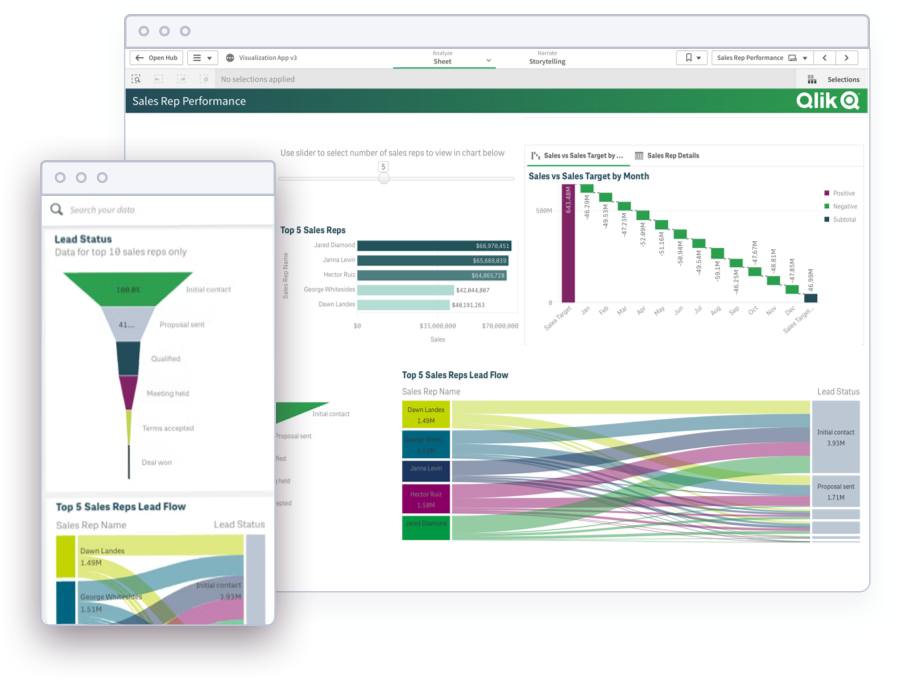
Dashboard Demo Videos
See how to explore information and quickly gain insights.
- Combine data from all your sources
- Dig into visualizations and dashboards
- Get AI-generated insights

