What is Descriptive Analytics?
What it means, why it matters, and how it works. This guide provides definitions and practical advice to help you understand modern descriptive analytics.
What is Descriptive Analytics?
Descriptive analytics focuses on summarizing and interpreting historical data to gain insights into events, patterns, and trends in a business. It involves the exploration and examination of data through various statistical techniques, visualizations, and KPI reports to provide a clear understanding of what has happened. This provides you a foundation for decision-making, performance evaluation, and operational improvements.
Four Types of Analytics
Descriptive analytics sets the foundation for the other 3 types of analytics—diagnostic, predictive, and prescriptive analytics. While descriptive analytics focuses on summarizing past data to understand what has happened, diagnostic analytics delves deeper to determine why something happened by uncovering root causes and relationships. Predictive analytics takes it a step further by using historical data patterns and statistical models to forecast future outcomes. Lastly, prescriptive analytics utilizes insights from the previous types to provide recommendations on the best course of action, optimizing your decision-making processes.
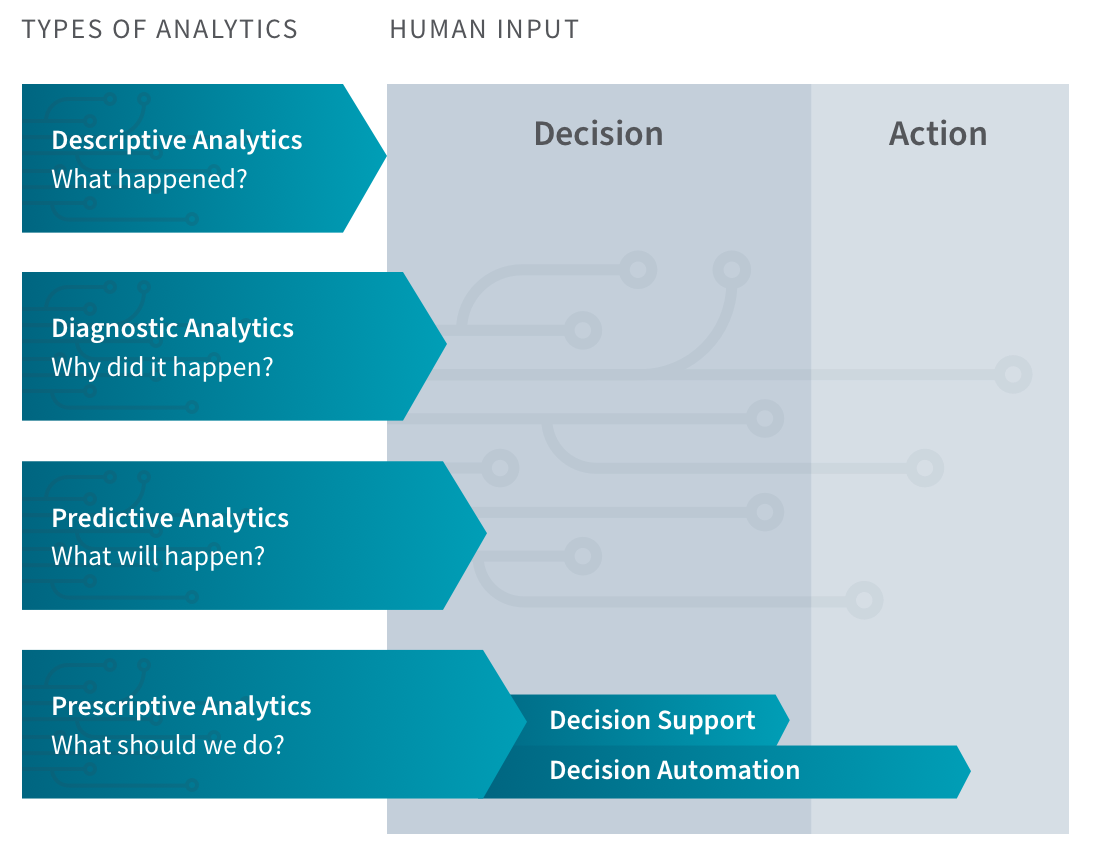
Descriptive analytics provides the necessary context and understanding for your organization to then diagnose, predict, and prescribe actions based on data-driven insights, forming a comprehensive analytical framework.
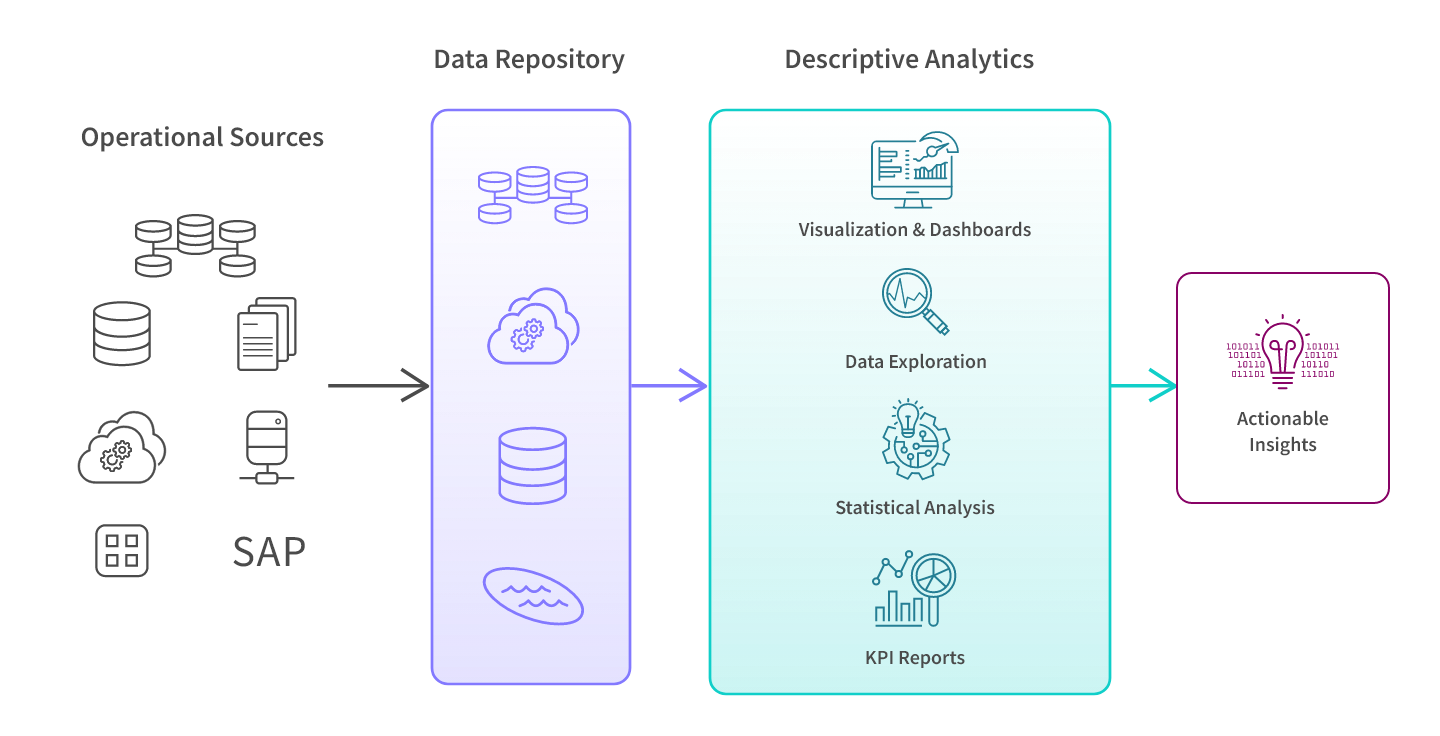
How It Works
Descriptive analytics works by analyzing and summarizing historical data to provide insights into past events, patterns, and trends. This is why it’s more similar to reporting vs analytics as most people think of it. The process typically involves several steps:

Collect Data: First, you collect relevant data from various operational sources, such as databases, spreadsheets, or data warehouses. This data can include structured data such as numerical values, categorical variables, as well as unstructured data like text or images.
Clean & Prep Data: You then clean and process this data to ensure accuracy and consistency. This step involves handling missing values, removing duplicates, and transforming the data into a suitable format for analysis. This step can happen before or after the data is loaded into a data repository.
Explore Data: Apply exploratory data analysis techniques to gain a better understanding of the dataset. This includes examining summary statistics, distributions, and visualizations to identify patterns, outliers, and relationships within the data.
Summarize Data: Calculate descriptive statistics to summarize the dataset, providing key metrics such as mean, median, mode, standard deviation, and percentiles. These statistics offer a concise overview of the dataset's central tendencies and dispersion.
Visualize Data: Create visual representations, such as charts, graphs, and dashboards, to present the data in a visually appealing and easily understandable format. Visualizations help identify trends, patterns, and anomalies more intuitively.
Interpret Data: Interpret the summarized data and visualizations to extract meaningful insights and observations about the past events and trends. This analysis enables stakeholders to understand the data's implications and make informed decisions based on the findings.
10 Ways to Take Your Visualizations to the Next Level
Advantages and Disadvantages
Descriptive analytics offers several advantages such as providing historical insights, supporting data-driven decision-making, and identifying patterns and trends. However, it also has limitations, including the potential for oversimplification, reliance on quality data, and its reactive nature rather than being proactive in addressing future challenges. Let’s dig in a bit deeper:
Advantages:
- Provides a historical perspective: Descriptive analytics allows businesses to gain insights into past events, patterns, and trends, providing a valuable historical context for decision-making.
- Easy to understand and interpret: Summarized and visualized data makes it accessible to a wide range of users, enabling easy understanding and interpretation of the information.
- Facilitates data-driven decision-making: By analyzing and summarizing data, it helps organizations make informed decisions based on evidence rather than relying solely on intuition or guesswork.
- Identifies patterns and trends: It uncovers patterns and trends within data, allowing businesses to identify opportunities, risks, and areas for improvement.
- Supports performance evaluation: By providing metrics and key performance indicators (KPIs), it aids in evaluating business performance, measuring progress, and setting benchmarks.
Disadvantages:
- Limited in terms of insights: It primarily focuses on summarizing past data and may not provide in-depth insights into the underlying causes or future predictions.
- Lack of context: It may present data without providing sufficient context or explanations, requiring additional analysis and interpretation to derive meaningful insights.
- Reactive rather than proactive: It deals with historical data, which means it offers insights into past events but may not proactively address future challenges or anticipate changes.
- Reliance on quality data: Accurate and high-quality data is crucial and if the underlying data is incomplete, inaccurate, or biased, the insights derived may be flawed or misleading.
- Potential oversimplification: Summarizing complex data into simplified metrics and visualizations can oversimplify the intricacies of the underlying information, potentially missing important nuances.
Descriptive Analytics Examples
A wide range of job roles and industries leverage descriptive analytics. Here are some descriptive analytics examples for different industries:
-

Insurance: Analyzing historical claim data to identify patterns and trends in order to assess risk and set insurance premiums accurately.
-

Financial services: Examining past transaction data to analyze customer spending patterns and identify potential areas for cost reduction or revenue generation.
-

Retail: Analyzing sales data from previous promotional campaigns to determine which offers and strategies were most effective in driving customer purchases.
-

Healthcare: Studying patient admission and readmission data to identify factors and patterns that contribute to better patient care and optimize resource allocation.
-

Energy: Analyzing historical energy consumption data to forecast future energy needs, optimize distribution, and identify potential areas for energy conservation.
-

Life Sciences: Developing patient personas and analyzing adherence data to predict the probability of nonadherence to treatment plans and design targeted interventions.
-

Manufacturing: Analyzing production and quality data to identify factors that lead to production failures, improve process efficiency, and enhance product quality.
-

Public Sector: Analyzing public service utilization data to identify areas of high demand, optimize resource allocation, and improve service delivery efficiency.
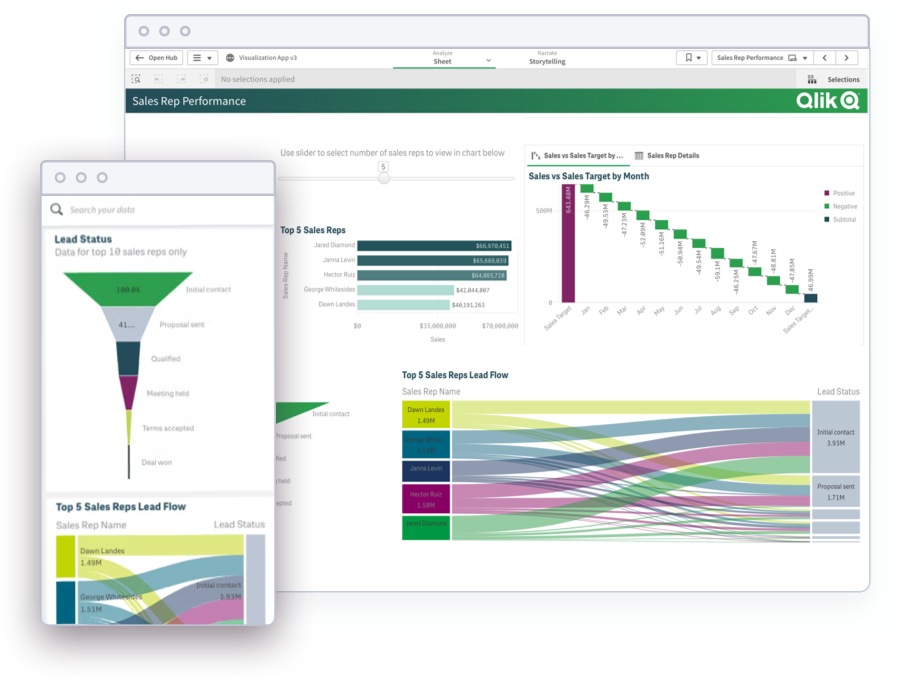
Modern Analytics Demo Videos
See how to explore information and quickly gain insights.
- Combine data from all your sources
- Dig into KPI visualizations and dashboards
- Get AI-generated insights
Frequently Asked Questions
Compare Descriptive vs Diagnostic vs Predictive vs Prescriptive Analytics
Descriptive analytics focuses on summarizing and interpreting historical data to provide insights into past events, patterns, and trends. It answers the question of "what happened?" Diagnostic analytics goes further by analyzing the causes and reasons behind the observed patterns. It aims to answer the question of "why did it happen?" Predictive analytics utilizes historical data and statistical models to forecast future outcomes and trends, answering the question of "what is likely to happen?" Lastly, prescriptive analytics takes insights from descriptive, diagnostic, and predictive analytics to provide recommendations and actions for optimal decision-making, answering the question of "what should be done?" In essence, descriptive analytics explains the past, diagnostic analytics investigates the reasons behind it, predictive analytics forecasts the future, and prescriptive analytics suggests the best course of action.
What is an example of descriptive analytics?
In a retail setting, descriptive analytics can be employed to analyze sales data from a specific period to gain insights into customer purchasing patterns. By examining historical sales records, businesses can identify the most popular products, peak sales periods, and customer preferences. This analysis can further reveal geographic sales trends, customer demographics, and correlations between various product categories. Utilizing descriptive analytics, retailers can make data-driven decisions regarding inventory management, marketing strategies, and product assortment to better meet customer demands and optimize sales performance.
What does descriptive analytics do?
Descriptive analytics focuses on summarizing and interpreting historical data to provide a comprehensive understanding of past events, patterns, and trends. It involves organizing and presenting data in a meaningful format through statistical measures, visualizations, and other techniques. The primary goal is to answer questions about what has happened in the past. By analyzing data, it provides insights into the characteristics, behaviors, and relationships within the dataset. This information is valuable for businesses to gain a foundational understanding of their operations, identify areas for improvement, make informed decisions, and track performance based on historical data. Overall, it helps organizations derive meaningful insights and knowledge from their data, setting the stage for more advanced analytical processes and informed decision-making.
What are descriptive analysis techniques?
Descriptive analysis techniques encompass a range of methods used to summarize and analyze data in order to gain insights into past events, patterns, and trends. These techniques include statistical measures, data visualization, and exploratory data analysis. Statistical measures, such as mean, median, mode, standard deviation, and percentiles, provide numerical summaries of the data's central tendencies, dispersion, and distribution. Data visualization techniques utilize charts, graphs, and dashboards to visually represent the data, making it easier to understand and identify patterns or anomalies. Exploratory data analysis involves analyzing summary statistics, distributions, and visualizations to uncover relationships, correlations, and outliers within the dataset. By employing these descriptive analysis techniques, businesses can effectively summarize, present, and interpret their data, enabling better decision-making and actionable insights based on historical information.
What tools are used in descriptive analytics?
In descriptive analytics, various tools are used to effectively analyze and summarize data. BI tools such as Qlik Sense and Power BI provide the full range of capabilities, including statistical analysis, data visualization, and data integration. Otherwise, statistical software packages like R, Python (with libraries such as Pandas and NumPy), and SPSS are commonly employed to perform data calculations, generate summary statistics, and conduct statistical tests. Data visualization tools like Tableau, Qlik, and matplotlib help in creating visually appealing charts, graphs, and dashboards to present data in a clear and understandable format. Database management systems such as SQL enable efficient data storage, retrieval, and manipulation. Additionally, spreadsheet software like Microsoft Excel and Google Sheets are often utilized for basic data analysis and visualization.