Analytics Dashboard
Examples, benefits, and best practices. This guide provides practical advice to help you create world-class analytics dashboards of your own.
What is an Analytics Dashboard?
An analytics dashboard is an interactive graphical user interface that allows you to display, track, and analyze key performance indicators (KPIs) and metrics. Modern dashboards can combine real-time data from multiple sources and provide AI-assisted data preparation, chart creation, and analysis. In this way, analytics dashboards turn raw data into insights that improve your business.
Web Analytics Dashboard
A web analytics dashboard is a specialized type of dashboard used to monitor and analyze the performance of your website. It provides a visual representation of key metrics and data related to your website's traffic, user behavior, and overall effectiveness. This information helps you make informed decisions about content strategy, user experience improvements, and marketing efforts aimed at increasing traffic and conversions.
1. Simple web analytics

Click the dashboard to explore
This type of dashboard, similar to a Google Analytics dashboard, typically includes information such as:
- Traffic Sources: This section outlines where the website's visitors are coming from. It may break down sources into categories like organic search, direct traffic, referrals, and social media.
- Page Views and Sessions: These metrics indicate how many pages visitors view and how many separate visits (or sessions) are recorded on the website.
- Bounce Rate: This is the percentage of visitors who leave the website after viewing only one page, which can indicate how engaging or relevant the content is.
- Conversion Rate: This measures the percentage of visitors who complete a specific action, such as making a purchase or filling out a contact form.
- User Behavior: Information on how users navigate the site, including popular paths, landing pages, exit pages, and time spent on each page.
- Demographic and Geographic Data: This can include information about the location, age, gender, and interests of the website's visitors.
- Goal Completions: This feature allows businesses to track specific objectives, such as form submissions, downloads, or purchases.
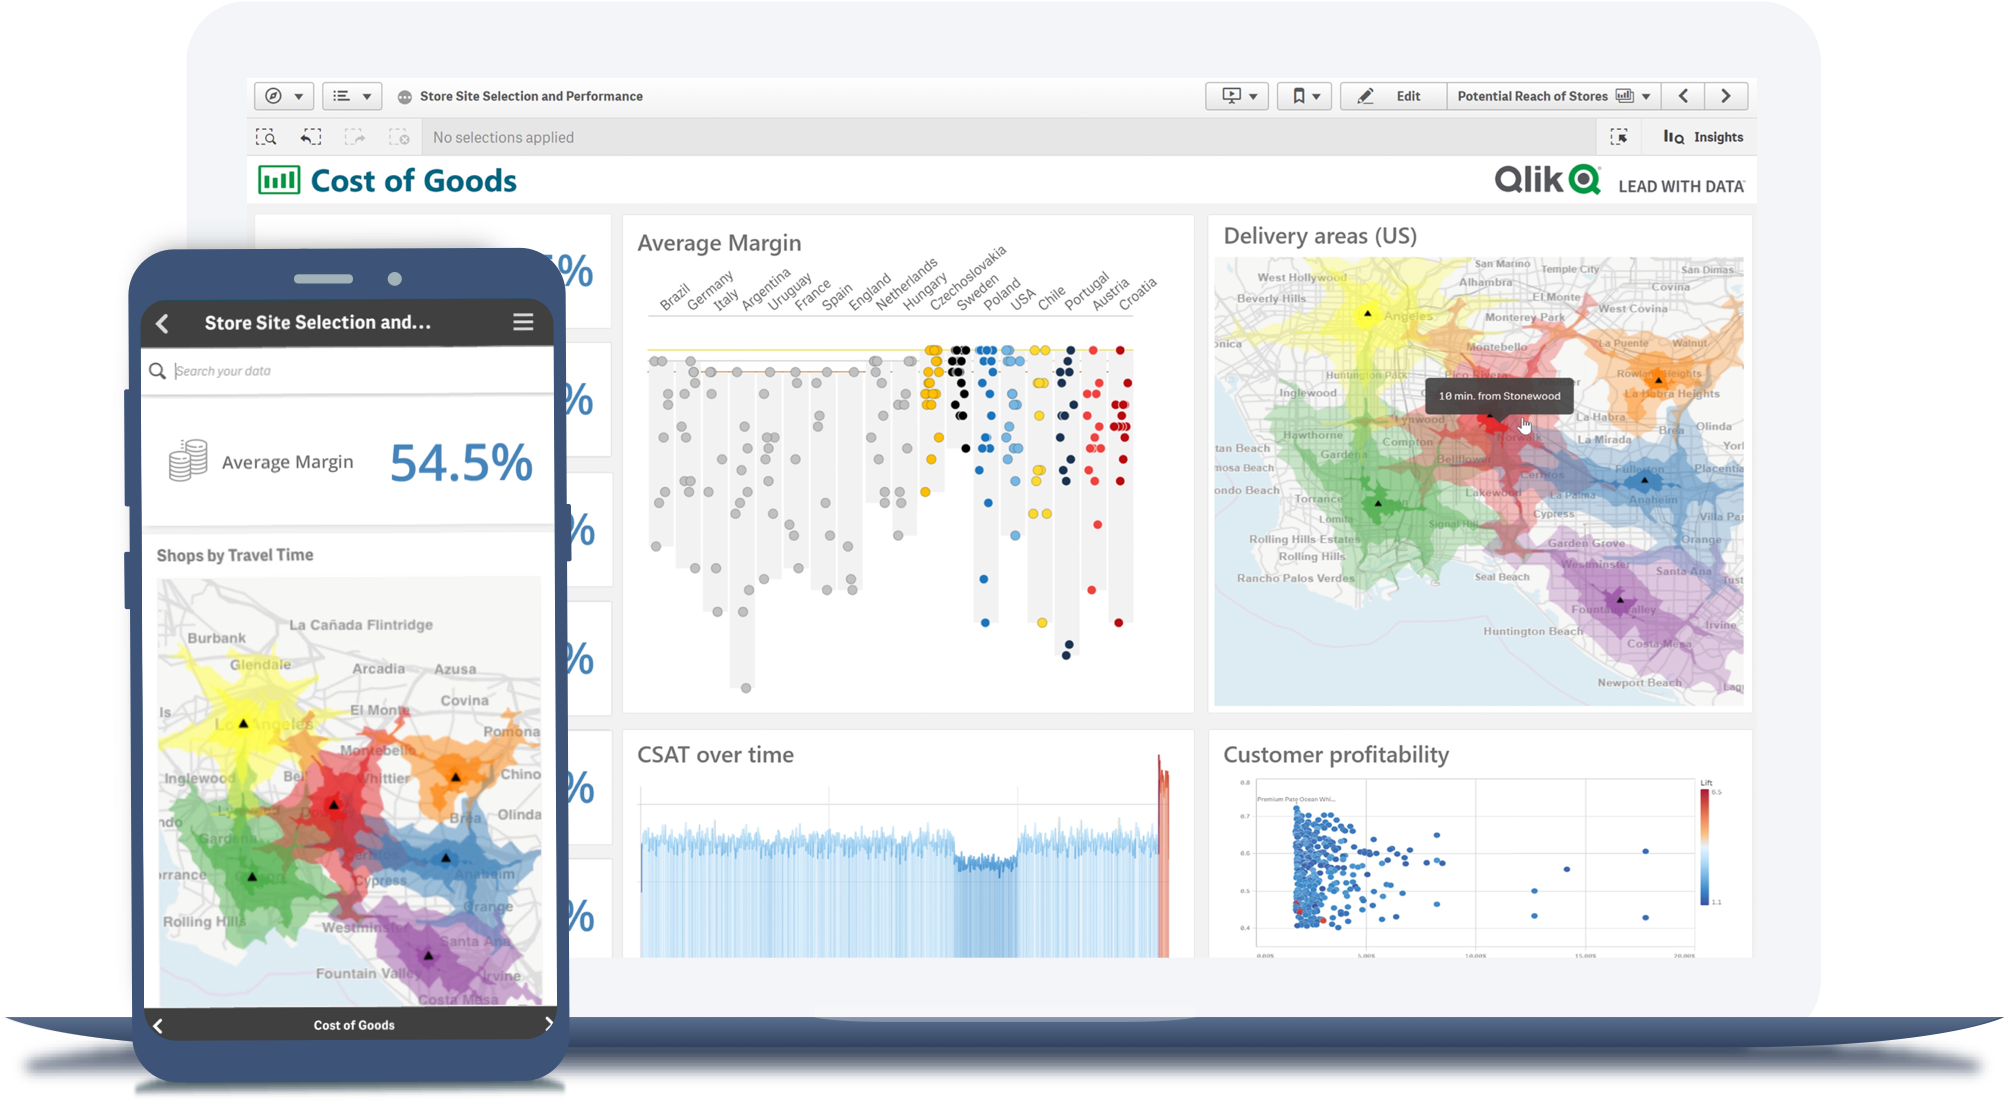
2. Sophisticated web analytics

This type of custom dashboard, available in a modern data analytics or business intelligence platform, brings together data from multiple systems to let you close the loop between marketing campaigns and revenue. This helps you to optimize your digital marketing budget and efforts, such as Google Ads and SEO, based on what’s actually driving revenue, not just activity on your website.
Analytics Dashboard Benefits
Overall, an analytics dashboard transforms Google Analytics data and other raw data sets into actionable insights, ultimately leading to more informed decision-making and improved business outcomes. Here are the four key benefits of any modern, well-designed dashboard.
Improved Decision-Making- Simplifying Complex Data: Dashboards use visualizations to present complex data in a clear and understandable manner.
- Identifying Trends and Patterns: By displaying data trends and patterns, dashboards assist in recognizing opportunities, threats, and potential areas for improvement.
- Facilitating Communication: The visual nature of dashboards simplifies the sharing of data-driven insights across teams.
Analytical dashboards centralize data from various sources, providing a unified and easily accessible view. This eliminates the need to manually gather and analyze data, saving time and ensuring accuracy.
Real-time InsightsThe best tools can access live data, providing you real-time monitoring and analysis of key performance metrics. This timely information enables quick reactions to changing situations and helps in staying ahead of trends.
Increased CollaborationDashboards promote teamwork and collaboration by offering a shared platform for viewing and discussing data. Teams can work together towards common goals, aligning efforts based on the insights provided by the dashboard.
Analytics Dashboard Examples
Here we describe the three types of data analytics dashboards. Each type serves a distinct purpose–catering to different levels of management and addressing specific timeframes and scopes of decision-making.
1) Operational Dashboards- Focus: Day-to-day operations.
- Purpose: Provide real-time updates on essential metrics and KPIs, enabling immediate actions and decisions related to operational activities. They are often used by front-line employees and managers to monitor ongoing processes and tasks.
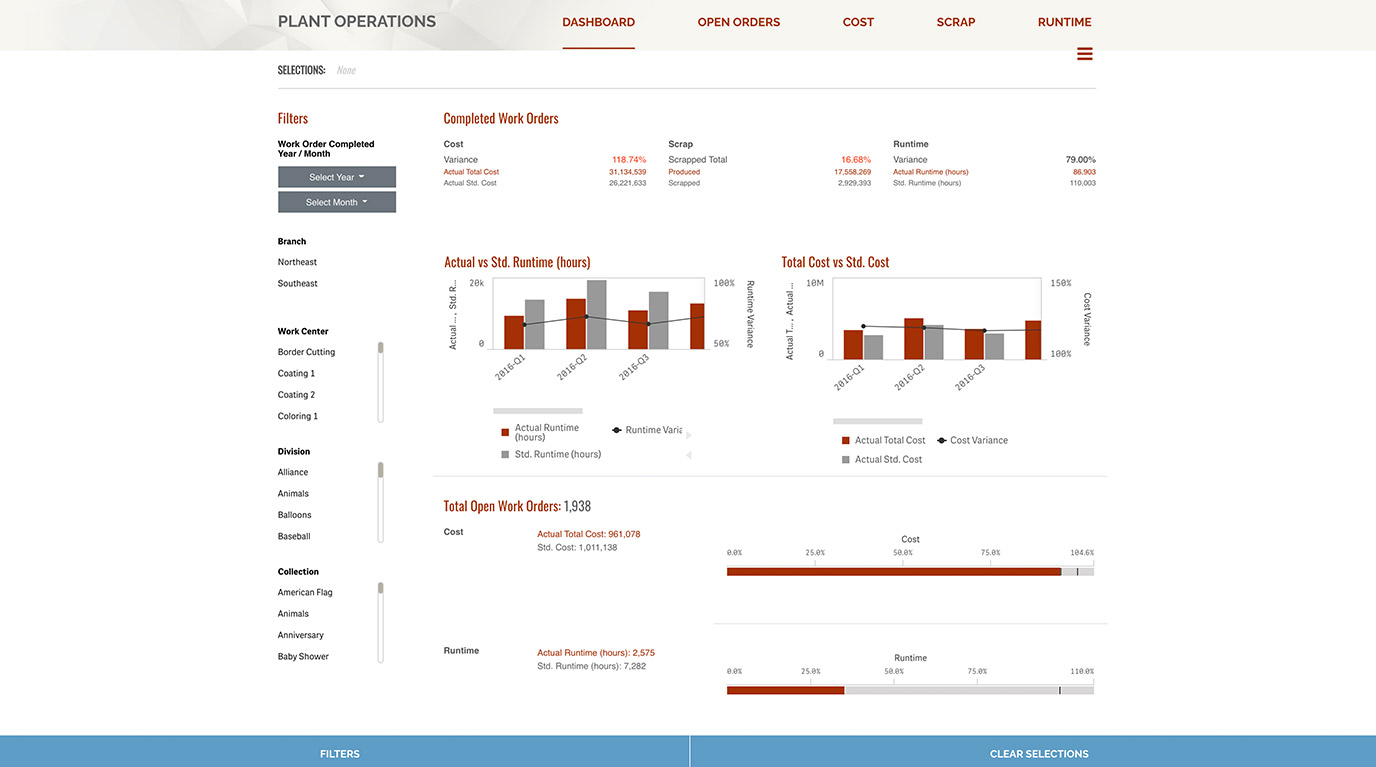
Click the dashboard to explore
This dashboard helps you find operational efficiencies by visualizing the details of plant operations, comparing actuals against standards for important KPIs. More operational dashboards.
2) Strategic Dashboards- Focus: Long-term goals and objectives.
- Purpose: Align with the overall strategic objectives of a business or organization. These dashboards highlight high-level KPIs that are critical for measuring progress towards long-term goals and the health of the business. They are typically used by top-level executives and decision-makers.
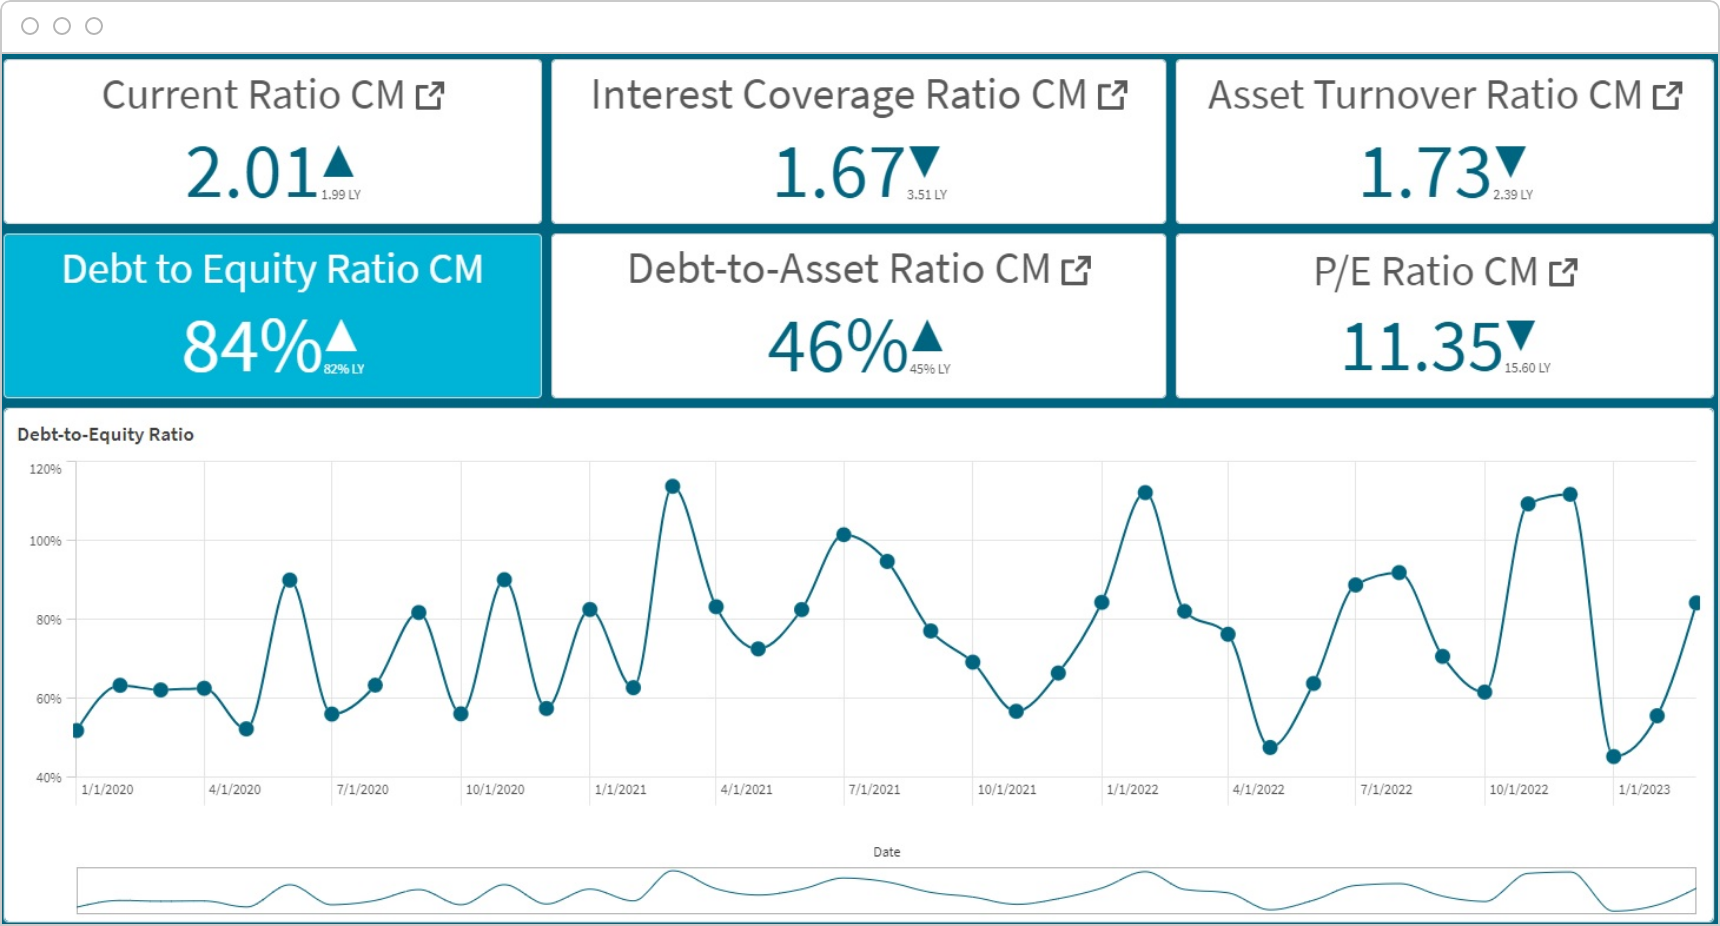
Click the dashboard to explore
This strategic dashboard helps executives track key leverage ratios such as debt-to-equity (D/E) and thereby better understand the company's risk profile and ability to service its debt obligations. More financial analysis dashboards.
3) Tactical Dashboards- Focus: Mid-term decision-making and planning.
- Purpose: Bridge the gap between operational and strategic dashboards. They offer insights that aid in mid-term decision-making, often related to specific projects, initiatives, or departments. Tactical dashboards help in monitoring progress towards more immediate objectives.
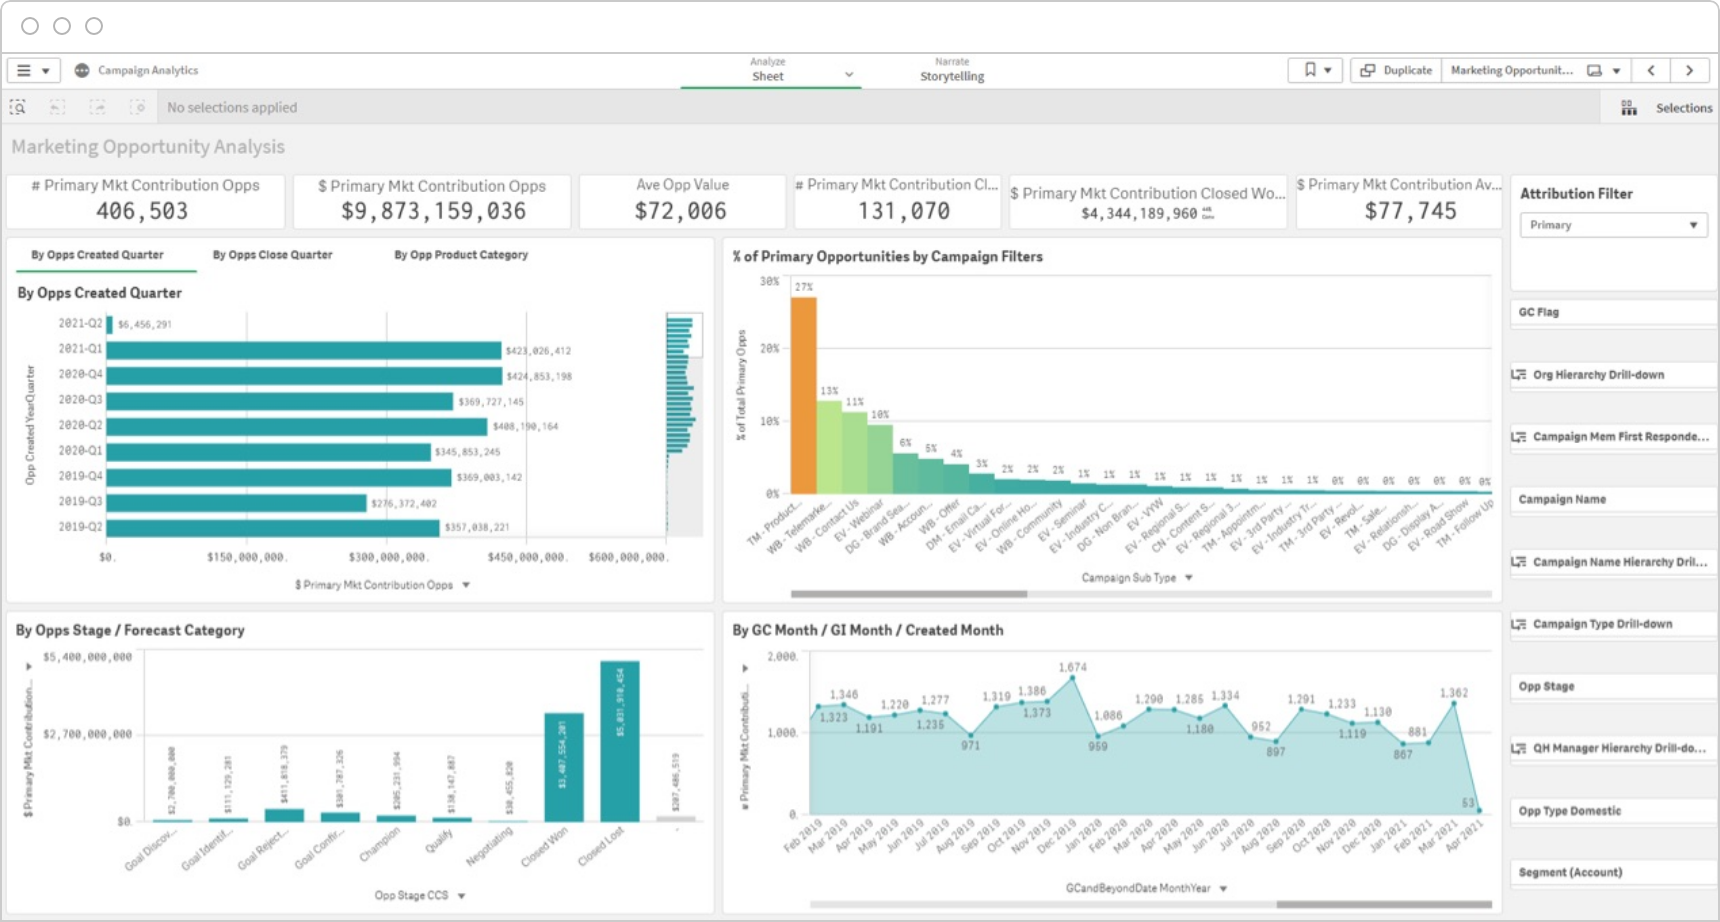
This tactical dashboard lets the marketing team know how their efforts impact pipeline creation and revenue using accurate campaign attribution. More marketing dashboards.
How to Design Best-in-Class Dashboards
Download our ebook with 4 must-see dashboard examples.
How to Create an Analytical Dashboard
Adhering to best practices will ensure that your business analytics dashboard is purposeful, user-friendly, and capable of delivering valuable insights to support informed decision-making. Here are a few best practices to consider as you build your own.
Setting Objectives- It’s crucial to clearly define the purpose and goals of your dashboard. This includes specifying who the dashboard is for and what questions your dashboard must answer. This ensures that the dashboard focuses on delivering relevant insights that align with your business's overall objectives.
- Carefully selecting the most pertinent KPIs is vital. These metrics should directly reflect the performance and progress towards the defined objectives. Choosing the right KPIs ensures that the dashboard provides meaningful insights.
- Beyond Google Analytics, identify which data you need and where it is located. Then bring this data together from various sources to get a comprehensive view. This integration process ensures that the dashboard incorporates all relevant information needed for analysis.
- Data must be cleaned and standardized to remove inconsistencies, errors, or duplicates. Clean data ensures accurate and reliable insights.
- Visualizations should be clear, concise, and easy to interpret. Avoid clutter and choose the right type of visualization for each type of data.
- Incorporate interactive elements where applicable, allowing users to explore data and gain deeper insights.
- Maintain a consistent style and color scheme throughout the dashboard for a cohesive and user-friendly experience. Learn more about dashboard design.
10 Ways to Take Your Visualizations to the Next Level
Overcoming Common Challenges
Here are three common challenges associated with creating an analytics dashboard and how to overcome them.
Data Accuracy and Integrity- Challenge: Ensuring that the data displayed on the dashboard is accurate, reliable, and free from errors or inconsistencies can be a significant challenge.
- Solutions:
- Implement robust data validation processes and regularly perform data audits.
- Utilize data cleaning and validation tools to identify and rectify inaccuracies.
- Establish clear data governance practices to maintain data integrity over time.
- Use a modern data analytics platform because it allows you to spend less time preparing data, and more time analyzing it.
- Challenge: Meeting the specific needs and preferences of different users or departments can be challenging, as each may require different views, KPIs, or metrics.
- Solutions:
- Provide customization options within the dashboard, allowing users to personalize their views based on their specific requirements. Utilize features like filters, drill-downs, and user-defined widgets to enable tailored experiences.
- Regularly solicit feedback from users to refine and enhance customization options.
- Select a tool designed for easy self-service usage.
- Challenge: Getting users to adopt and regularly utilize the dashboard can be a hurdle. Some may find it unfamiliar or may prefer their existing methods of accessing and analyzing data.
- Solutions:
- Provide comprehensive training and onboarding for users to familiarize them with the dashboard's features and benefits.
- Embed dashboards anywhere you need them. Leading dashboard tools simplify the process of integrating a dashboard or graph into various applications, business workflows, portals, and websites. This capability empowers you to analyze your data at any time and in any place where you or your teams are making critical decisions.
- Set up your dashboard to auto-share with key stakeholders on a regular cadence, and to send alerts based on KPI fluctuations.
- Select a tool with fully native mobile. This means you can dig into your dashboards from any device, with full interactive functionality and touchscreen optimization.
- Select a tool with Augmented Analytics (AI). Powerful AI analytics will suggest specific analyses to perform, and insights to glean from your data.
Dashboard Demo Videos
See how to explore information and quickly gain insights.
- Combine data from all your sources
- Dig into visualizations and dashboards
- Get AI-generated insights
Analyst Perspectives
Compare the best reporting software with the latest analyst reports.
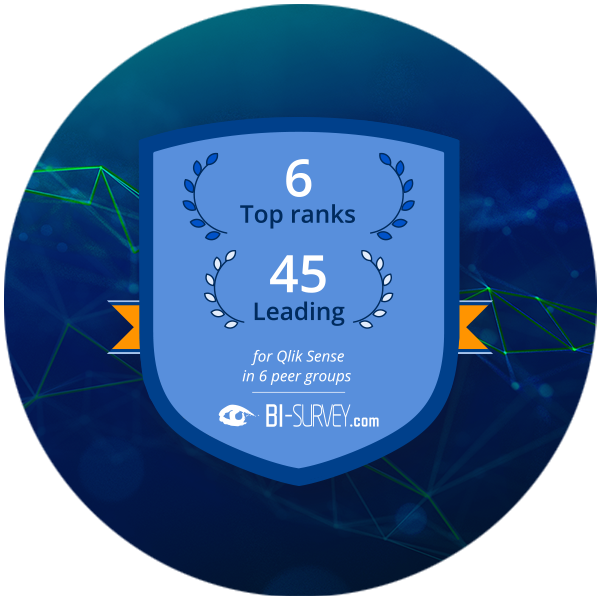
BARC: The BI & Analytics Survey 2023See how top dashboard and analytics tools stack up in the world’s largest independent survey of BI users.
-
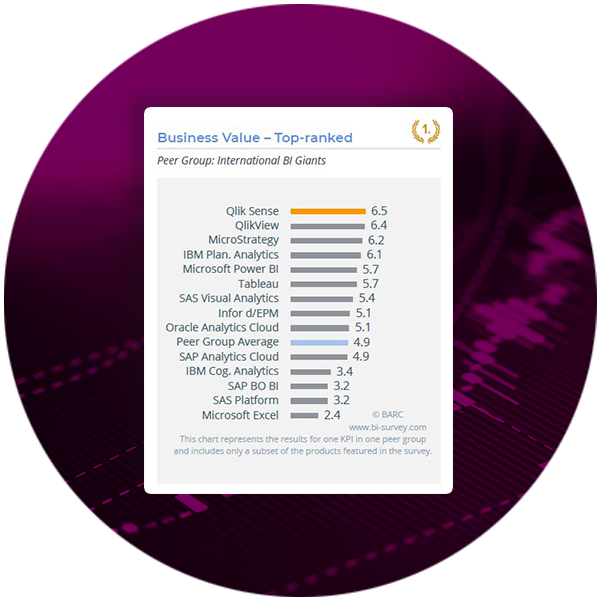 Qlik Sense earned 11 number one category rankings including Dashboards and Customer Experience and 44 leadership positions.
 -
 93% of surveyed users rate Qlik Sense’s functionality for creating dashboards as excellent or good.