Dashboard Examples
This guide showcases top-performing dashboard examples and templates. Explore real, interactive dashboards for your industry or job role.
Dashboard Examples Guide
Dashboard Examples
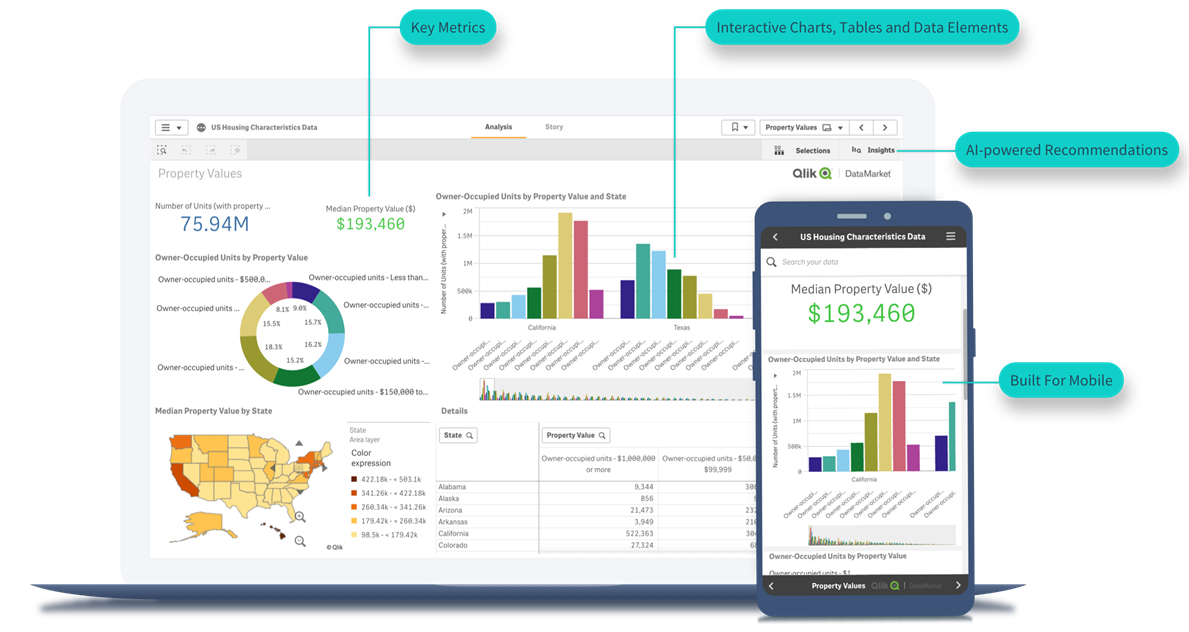
Dashboards are essential tools for transforming your data into business value. But there’s no single approach that works best for every organization. We've gathered top-performing examples of dashboards across specific industries and job roles. Click through to explore real, interactive dashboards and get inspired to create best-in-class dashboards of your own.
Dashboard Examples by Industry
-
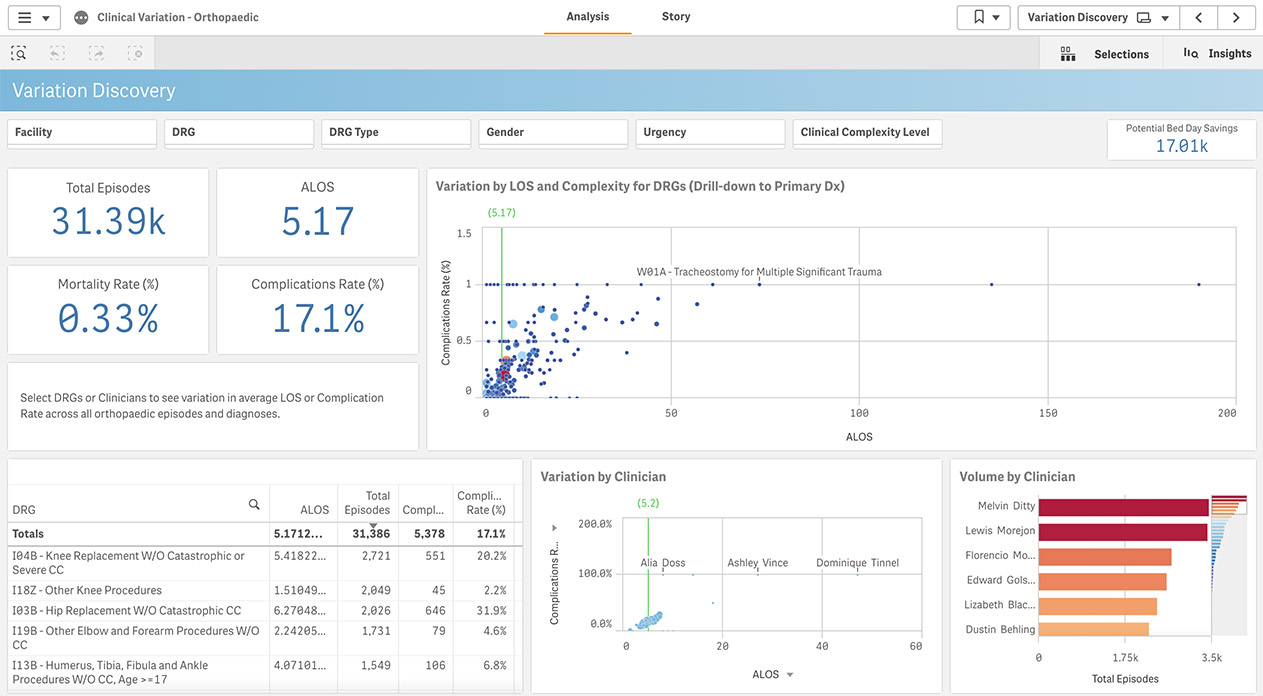
Healthcare
Analyze relevant patient care KPIs to uncover inefficiencies, manage your workforce more effectively, increase profitability, and improve patient outcomes.
-
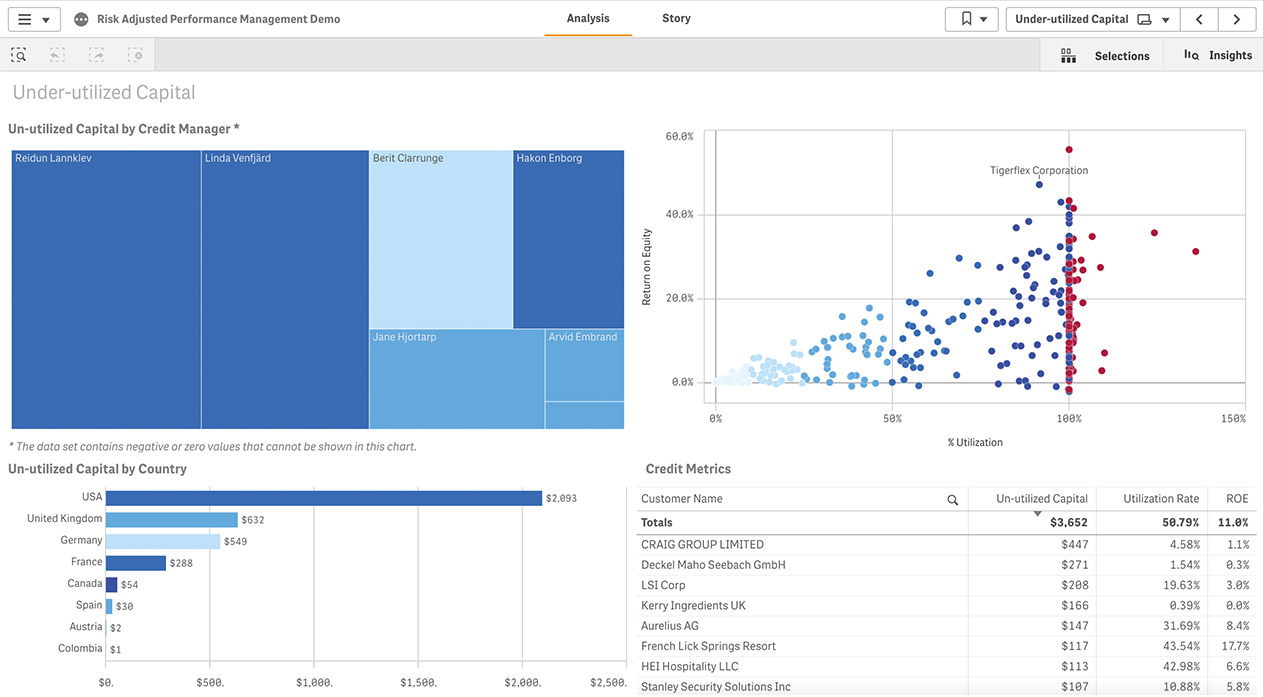
Financial Services
Compare at-a-glance revenue and margins to help you identify the most profitable customers, transform team performance, and reduce costs.
-
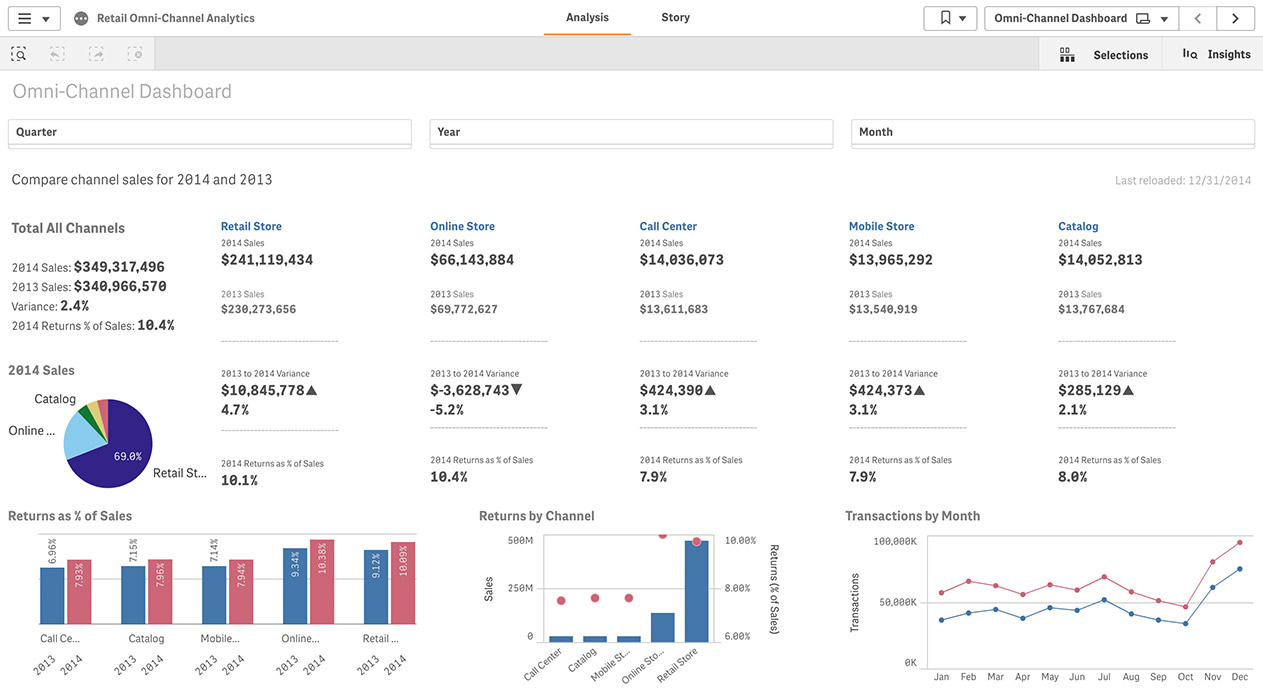
Retail
Quickly view and leverage the KPIs to drive shopper engagement and sales, maximize profit, and analyze shopping patterns by channel.
-
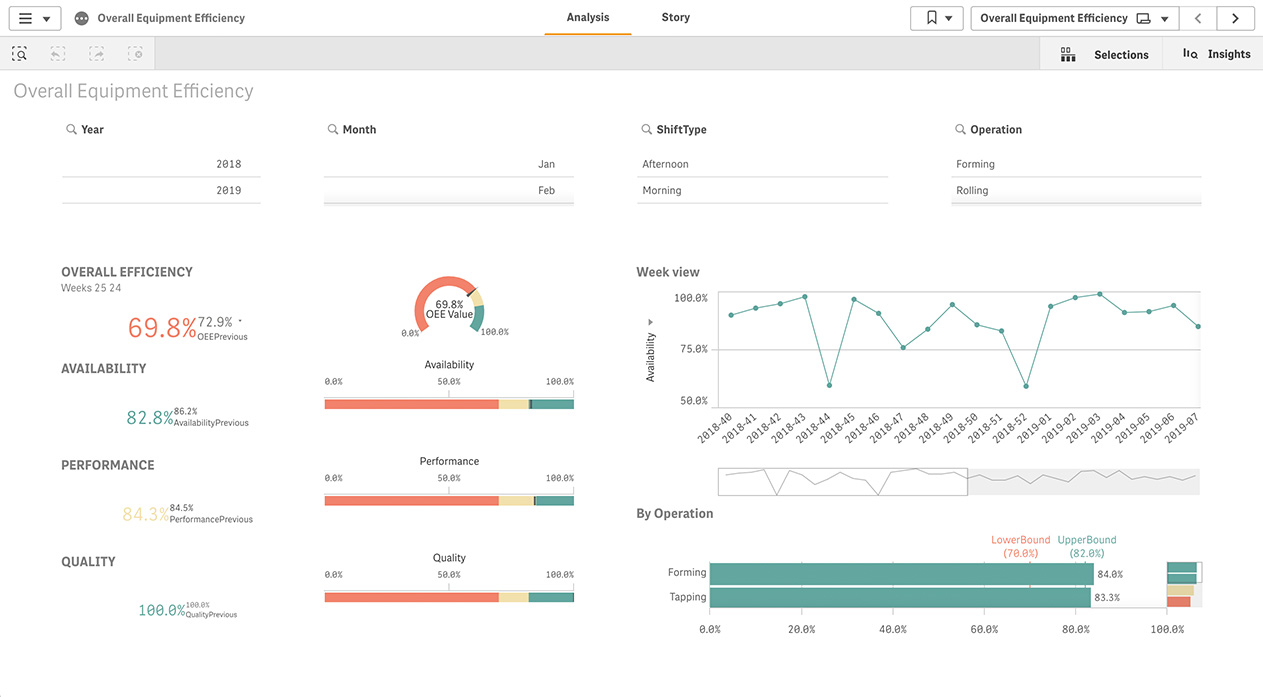
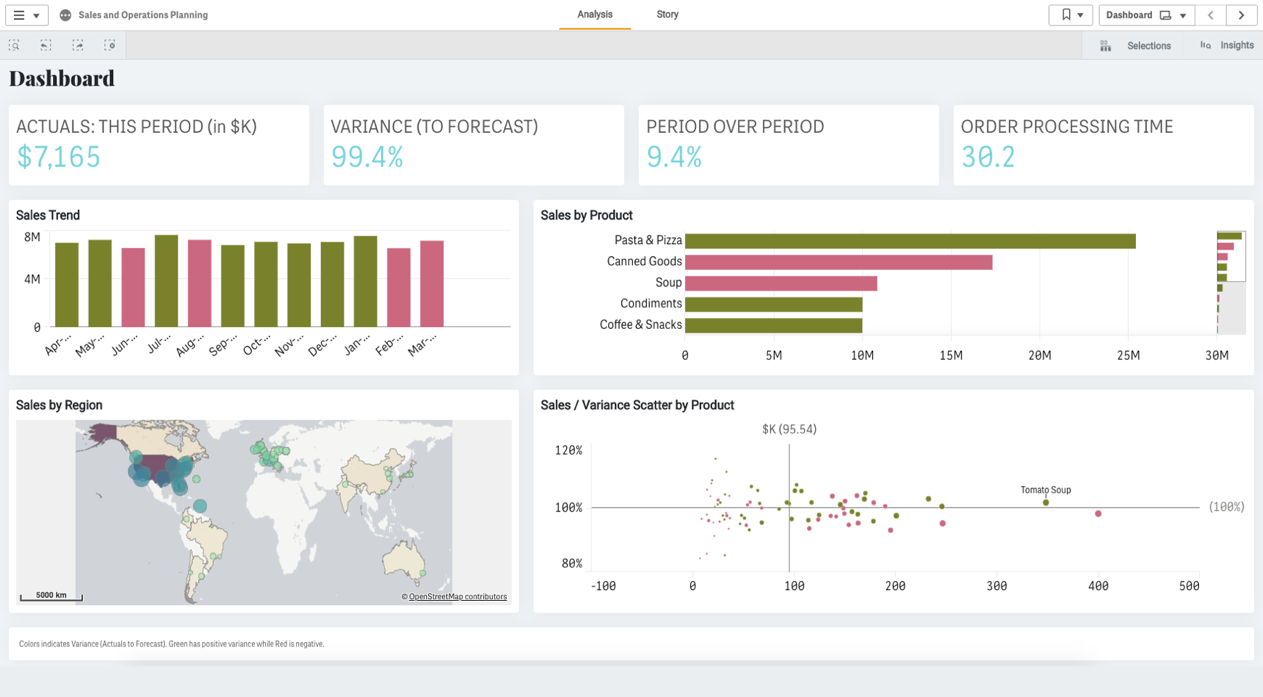
Manufacturing
Visualize even the smallest details of your plant operations, create operational and supply-chain efficiencies, and compare actuals versus standards for all your critical KPIs.
-
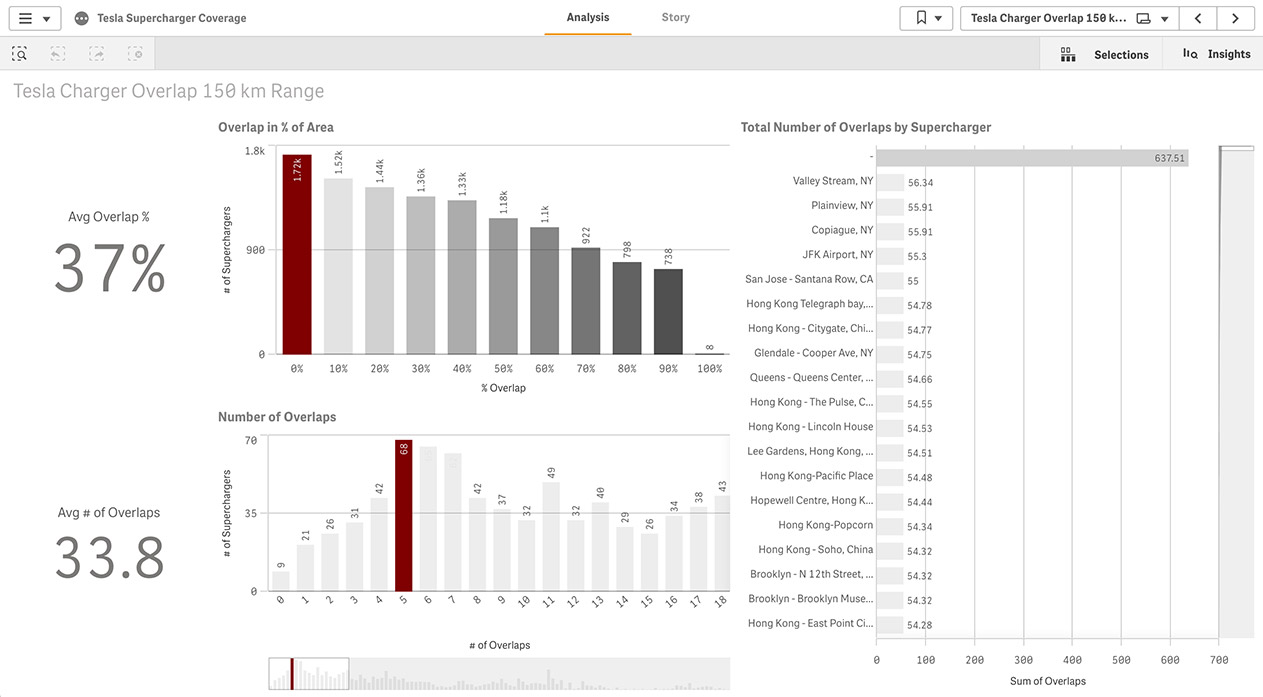
High Tech
Clean visualizations will help you gain global supply chain visibility, improve profitability, deliver more agile operations, and accelerate innovation.
-
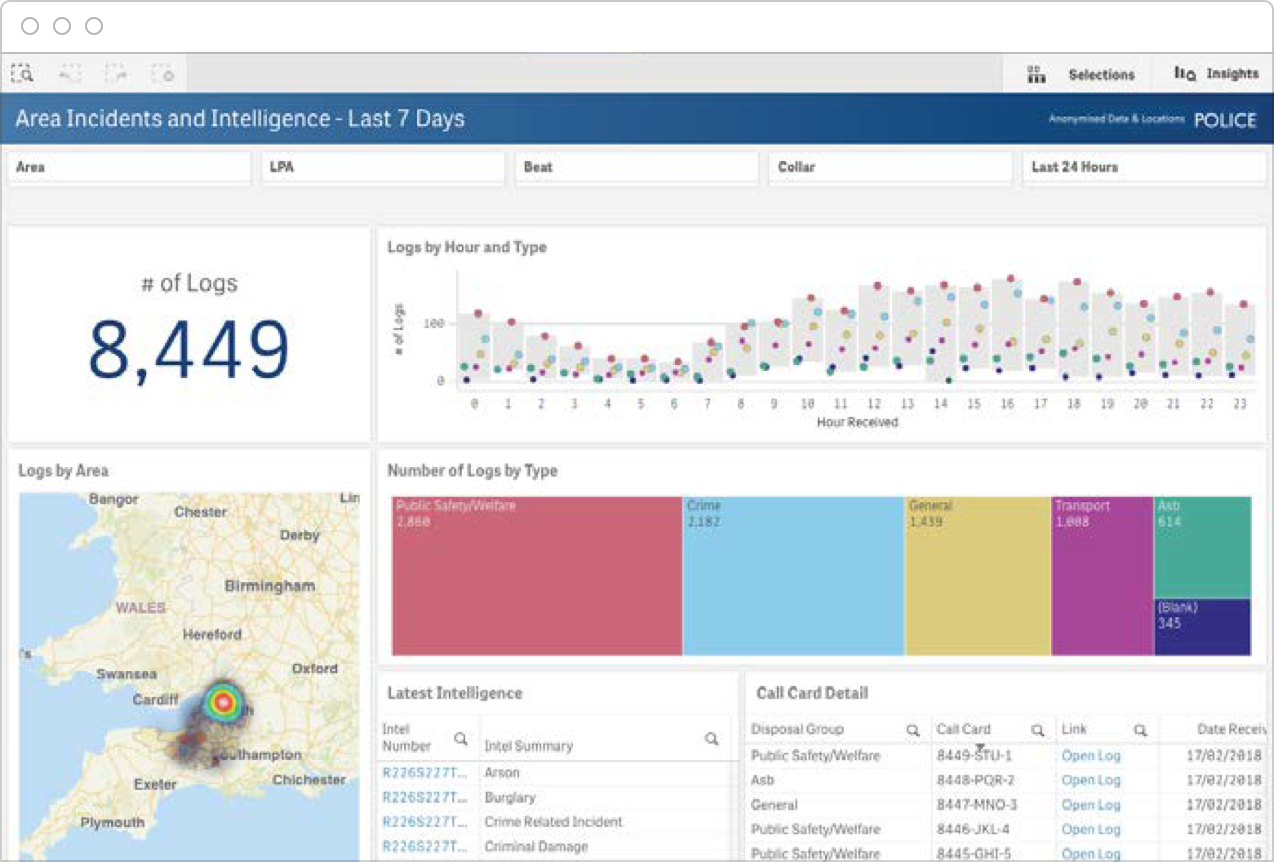
Public Sector
The right dashboard can help you visualize the right data to rapidly create scenarios, predict more accurate outcomes, and improve public health.
Dashboard Demo Videos
See how to explore information and quickly gain insights.
- Combine data from all your sources
- Dig into visualizations and dashboards
- Get AI-generated insights
-
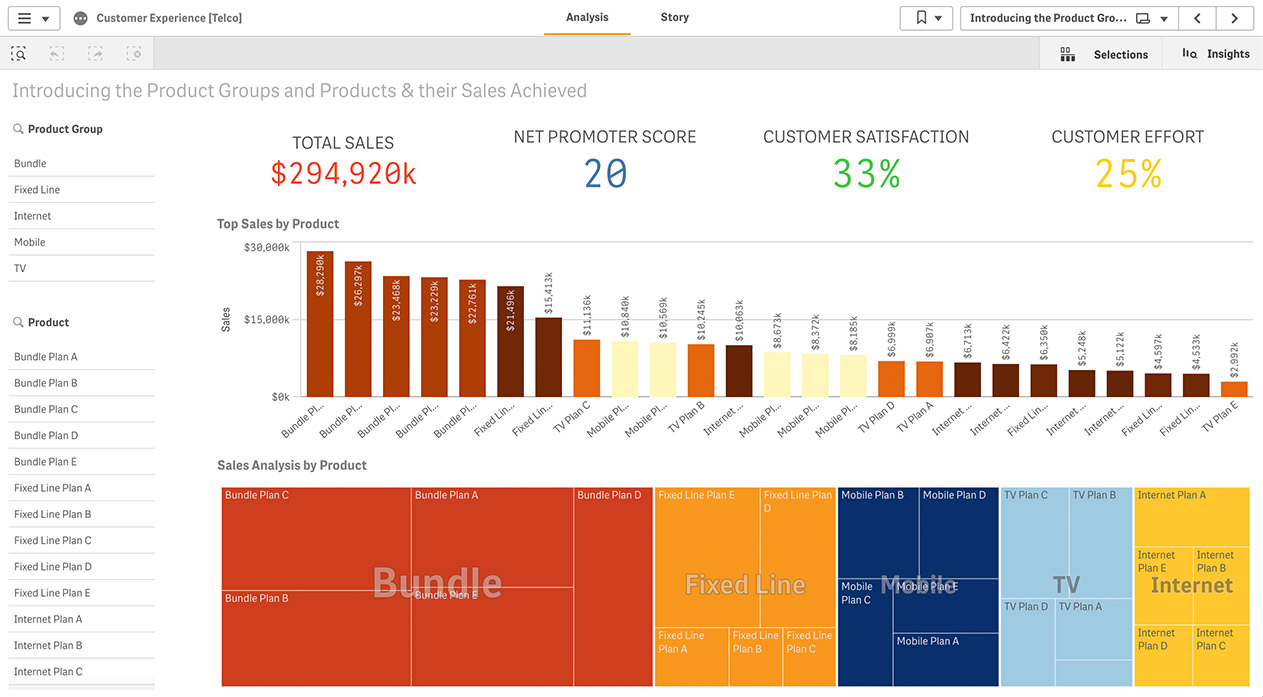
Media Telecom
Instantly surface KPIs to help you centralize your processes, navigate changing markets, and increase customer loyalty.
-
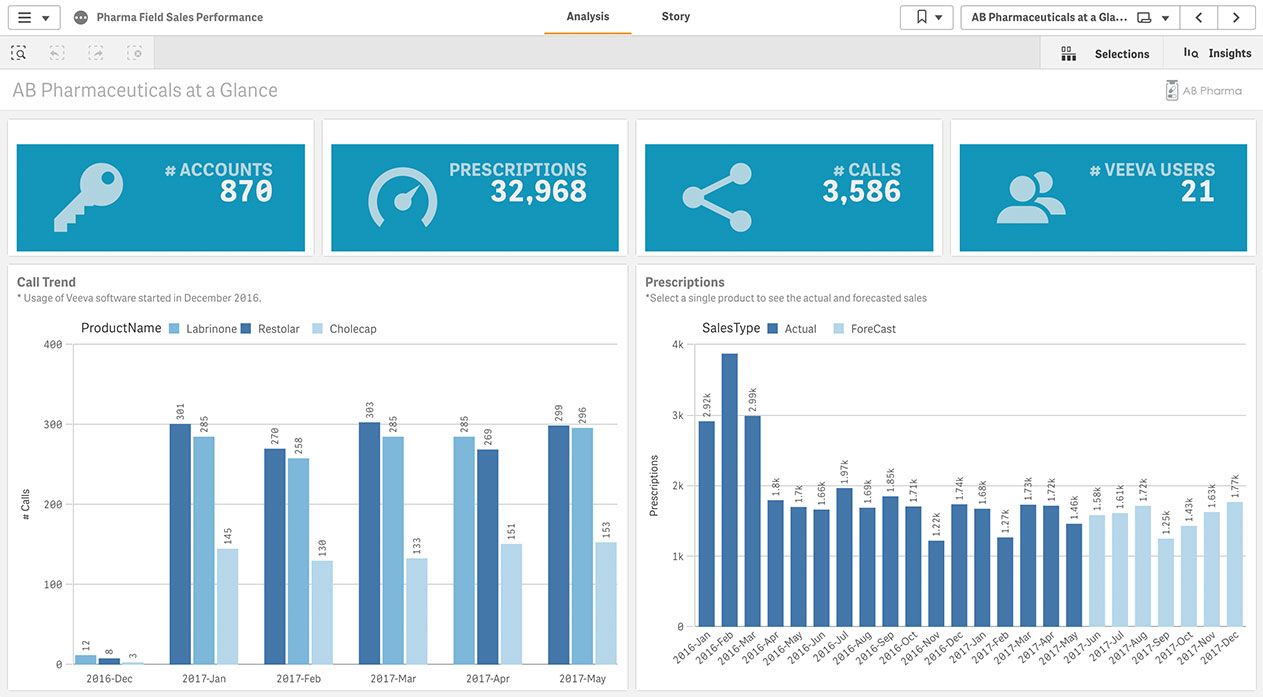
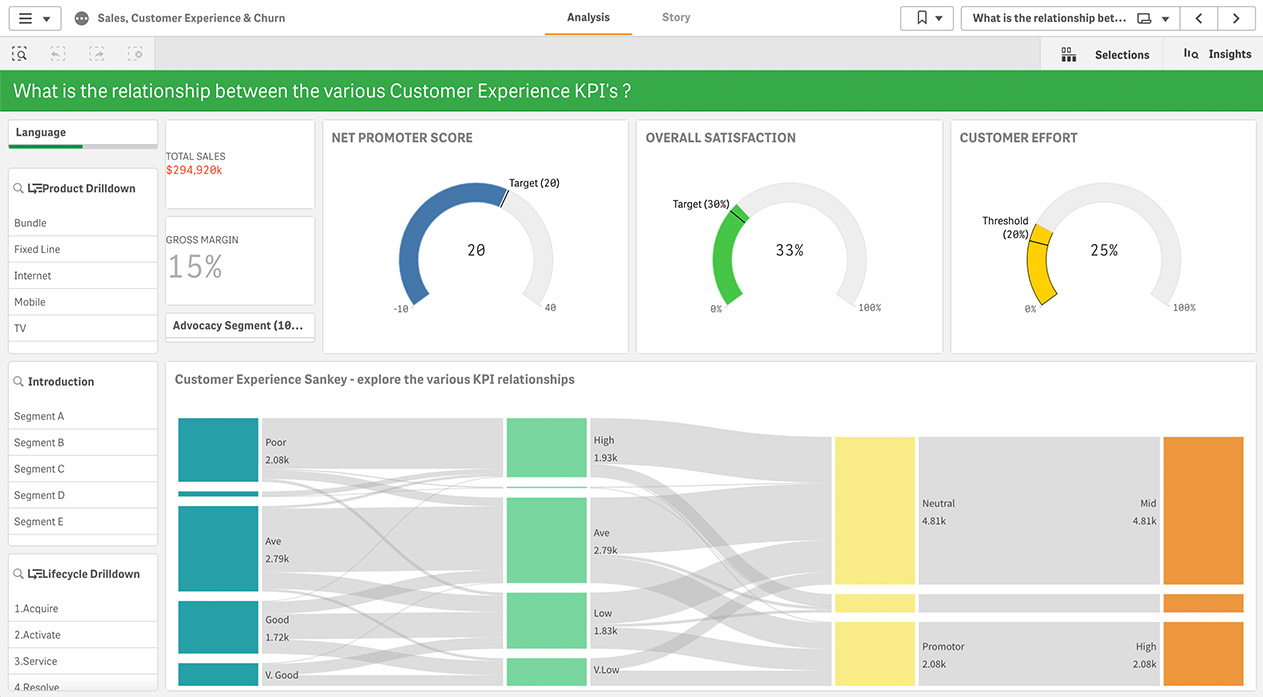
Life Sciences
Modern dashboards allow you to freely navigate and combine CRM data with market share data to target customers more effectively and adapt quickly to continuous change.
-
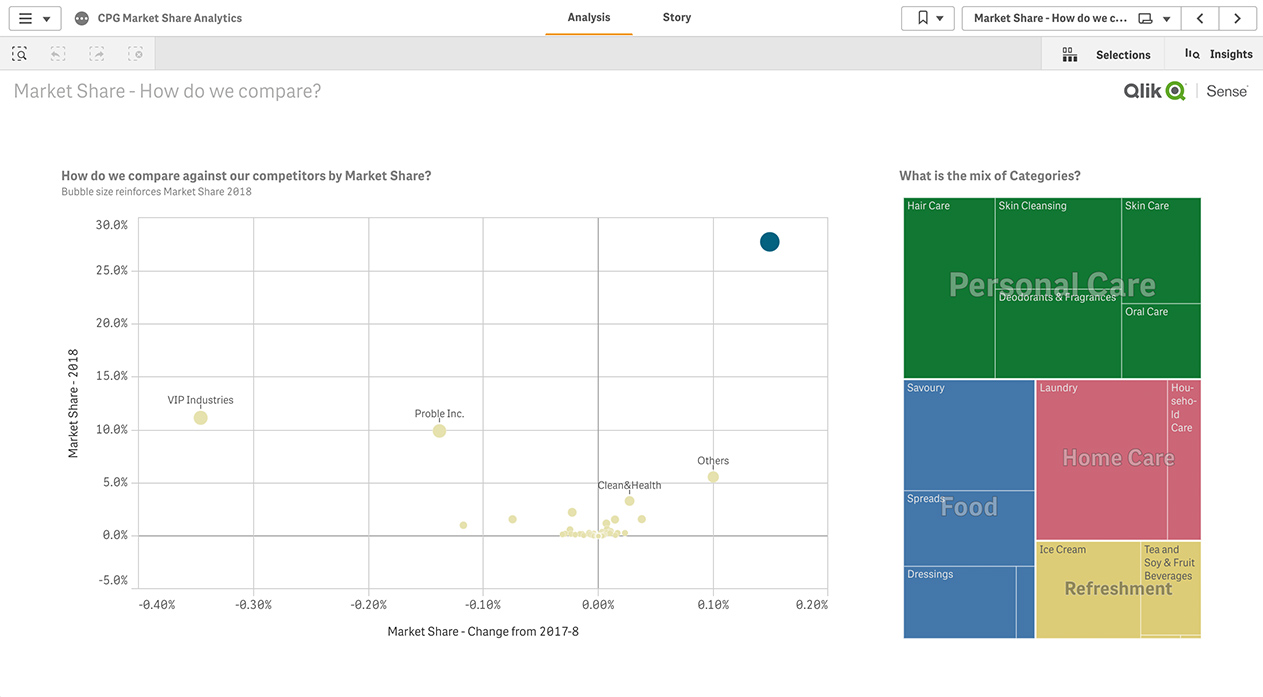
Consumer Products
Analyze at-a-glance trends to capture consumer loyalty, improve market share, manage intelligent supply chains, and optimize investment to drive sales.
Download our ebook with 4 must-see dashboard examples.
Examples of Data Dashboards by Job Function
Explore good dashboard examples based on key performance indicators relevant to your specific role.
-
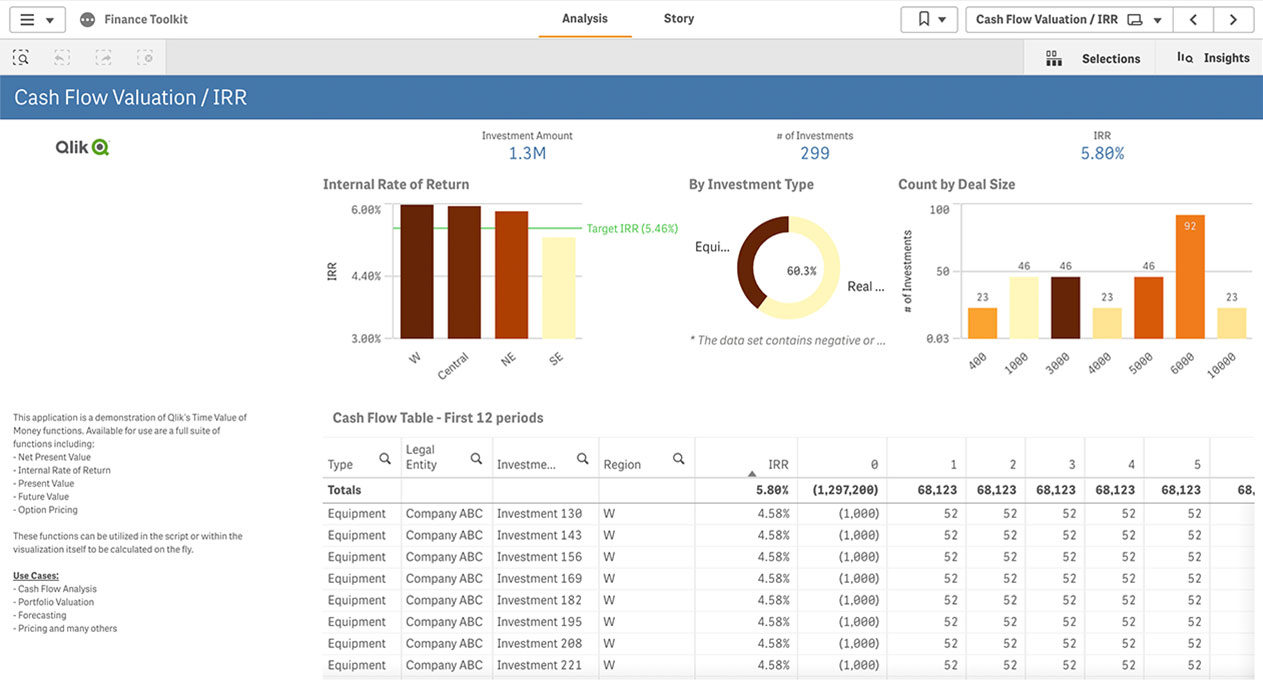
Finance
Dig into expense, contract, and procurement data to see the real cost of doing business. Discover new ways to manage risks, control costs and increase profitability.
-
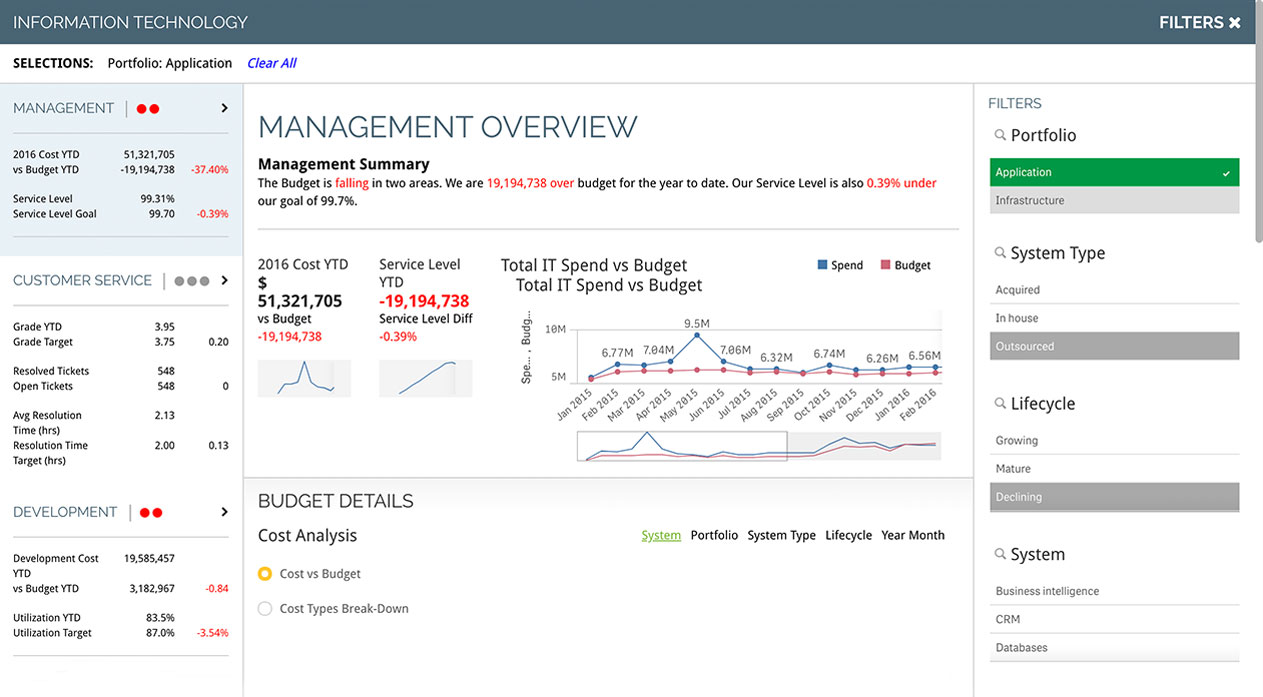
IT
Better data visualization will help you improve data governance, security and scalability. Spot underused applications and systems, and predict emerging technology needs.
-
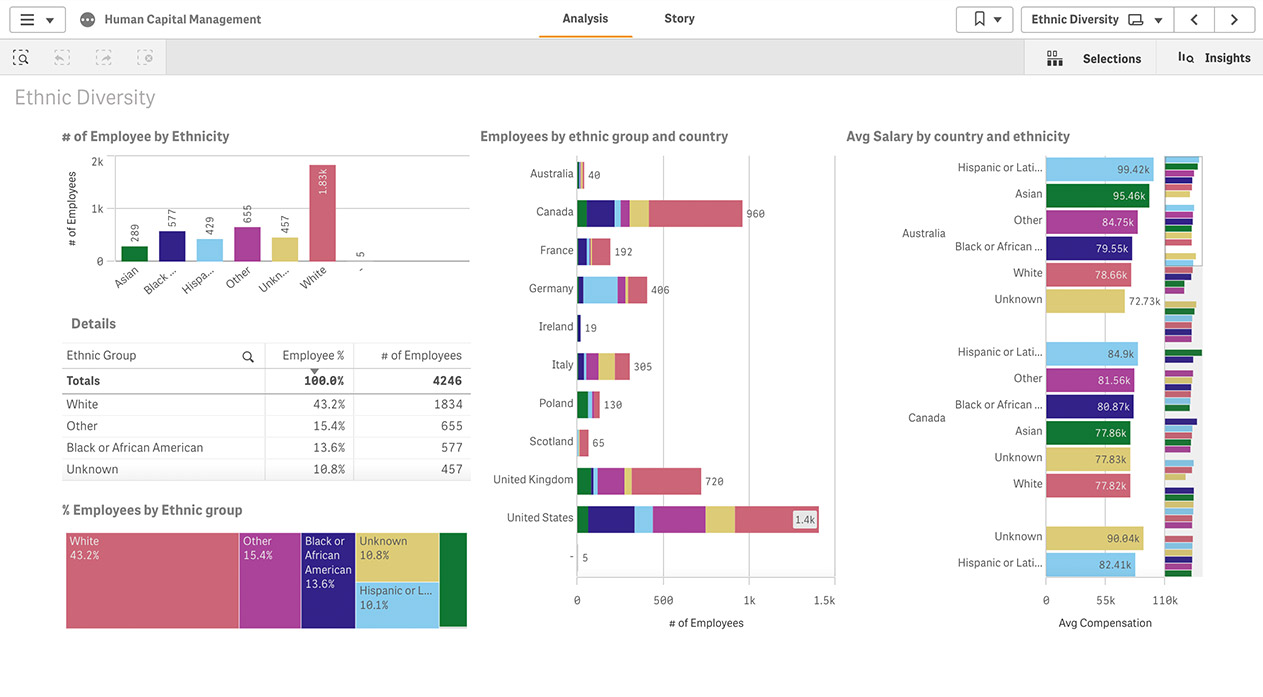
Human Resources
Quickly organize your data to make employee management more efficient. Oversee benefits, decrease turnover, and view employment data holistically across the organization.
-
Marketing
Modern dashboards combine data from your current web analytics, CRM and advertising tools. This helps you boost marketing ROI by analyzing and understanding all phases of your customer life cycle.
-
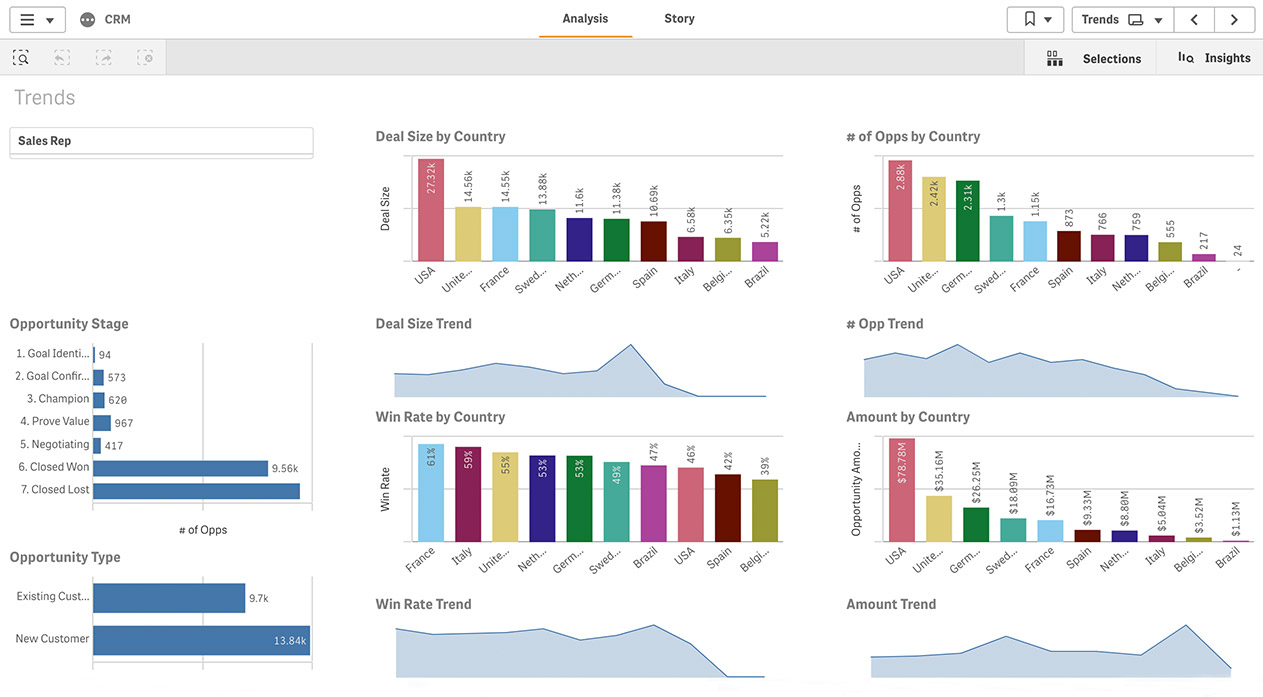
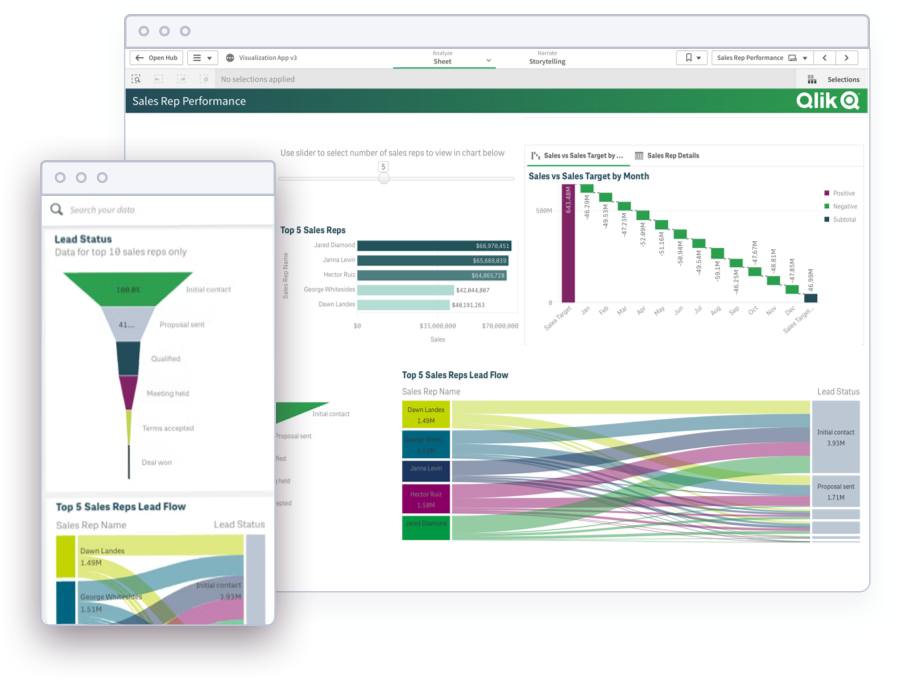
Sales
Sales dashboards that present clean, well-organized data will help you improve forecasting, increase revenue, monitor performance, and identify relevant trends.
-
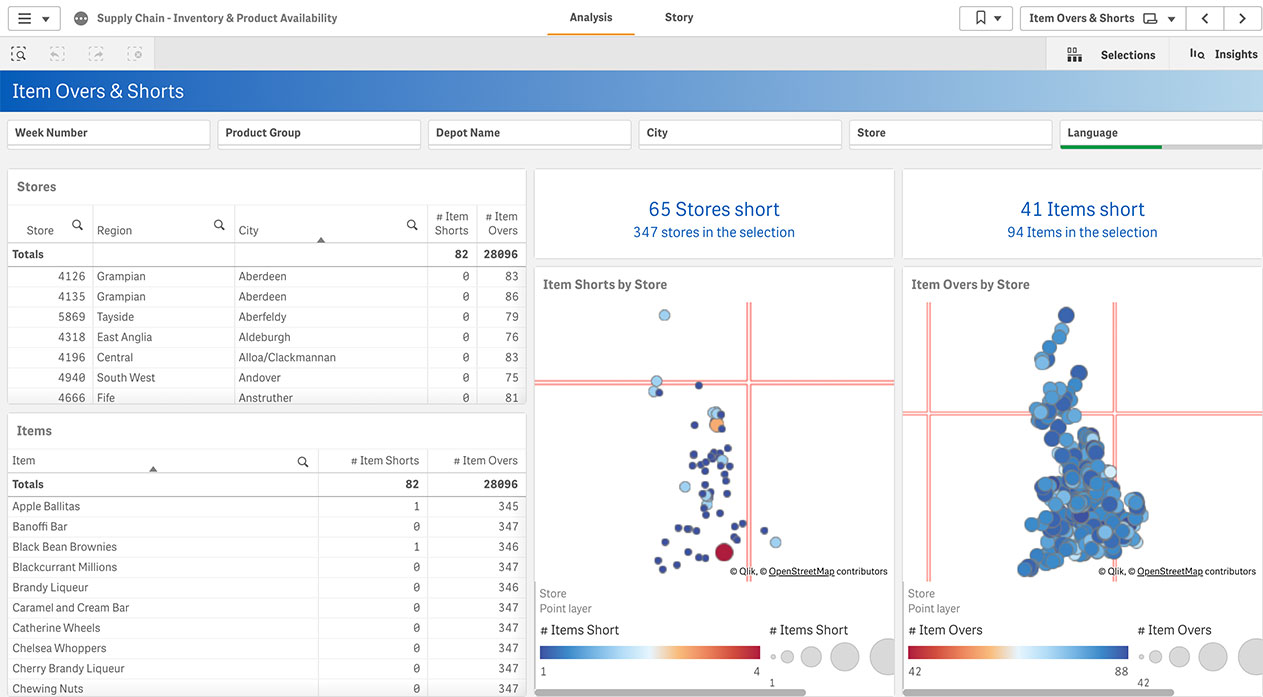
Supply Chain
Instantly surface KPIs to help you discover relationships between complex data sources. Improve planning, increase performance and monitor risk.
KPI Dashboards
KPI dashboards allow for quick review and analysis by displaying critical performance metrics in one place. KPIs vary by industry and organization and there’s no single approach for designing the best dashboard template, but implementing a set of time-tested strategic principles can help.