Digital Dashboard
What it is, why it matters, and best practices. This guide provides examples and practical advice to help you create a best-in-class digital dashboard of your own.
What is a Digital Dashboard?
A digital dashboard is a business intelligence tool that allows business leaders to track, analyze and report on KPIs and metrics. Modern, interactive dashboards make it easy to combine data from multiple sources and deeply explore and analyze the data directly within the dashboard itself.
Digital Dashboard Benefits
Visualizing data by using modern dashboard software can immediately benefit your organization by helping you...
Turn data into business valueMost organizations have vast amounts of unorganized data. Digital dashboards help users hone in on the most important data points, and better leverage the data to improve their business decisions.
Rally key stakeholdersDigital dashboards can be highly-effective tools for supporting and strengthening your case with decision makers across the organization. In addition to helping you quickly respond to changing business needs, the clear visualizations can help you present more compelling arguments for landing executive approvals.
Move data literacy forwardSharing dashboards of organized, trustworthy data will help to advance a data-driven culture throughout all levels of your business. When employees are able to explore data freely from a single location, users at all levels will be encouraged to make discoveries and innovate.
Dashboard Demo Videos
See how to explore information and quickly gain insights.
- Combine data from all your sources
- Dig into visualizations and dashboards
- Get AI-generated insights
Digital Dashboard Examples by Job Function
Explore digital dashboard examples based on key performance indicators (KPIs) relevant to your specific role.
-
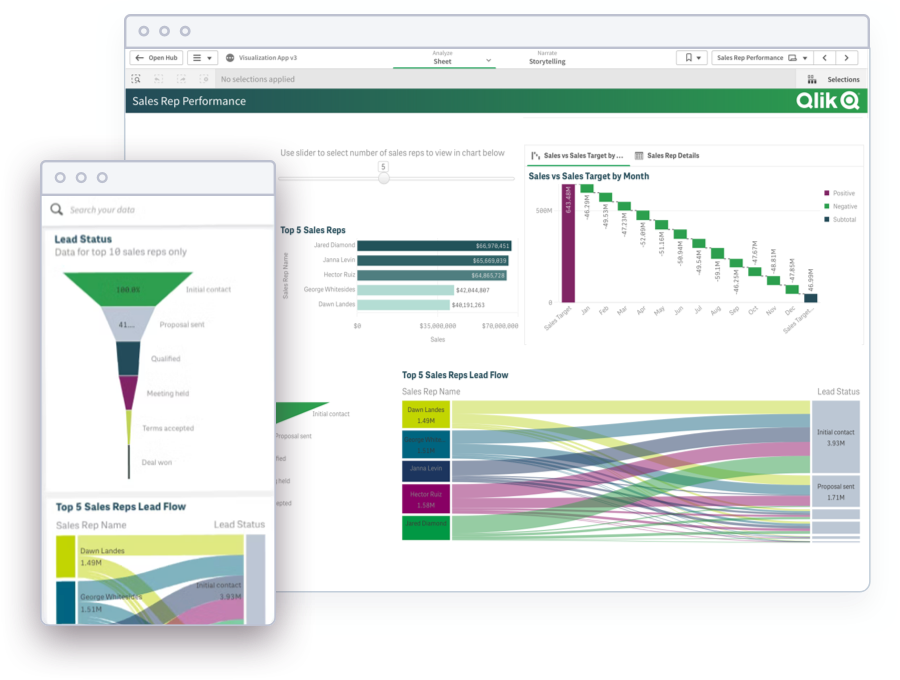
Sales
Viewing all your sales data in a clean, organized digital dashboard will help you increase revenue, improve forecasting, and identify key trends. -
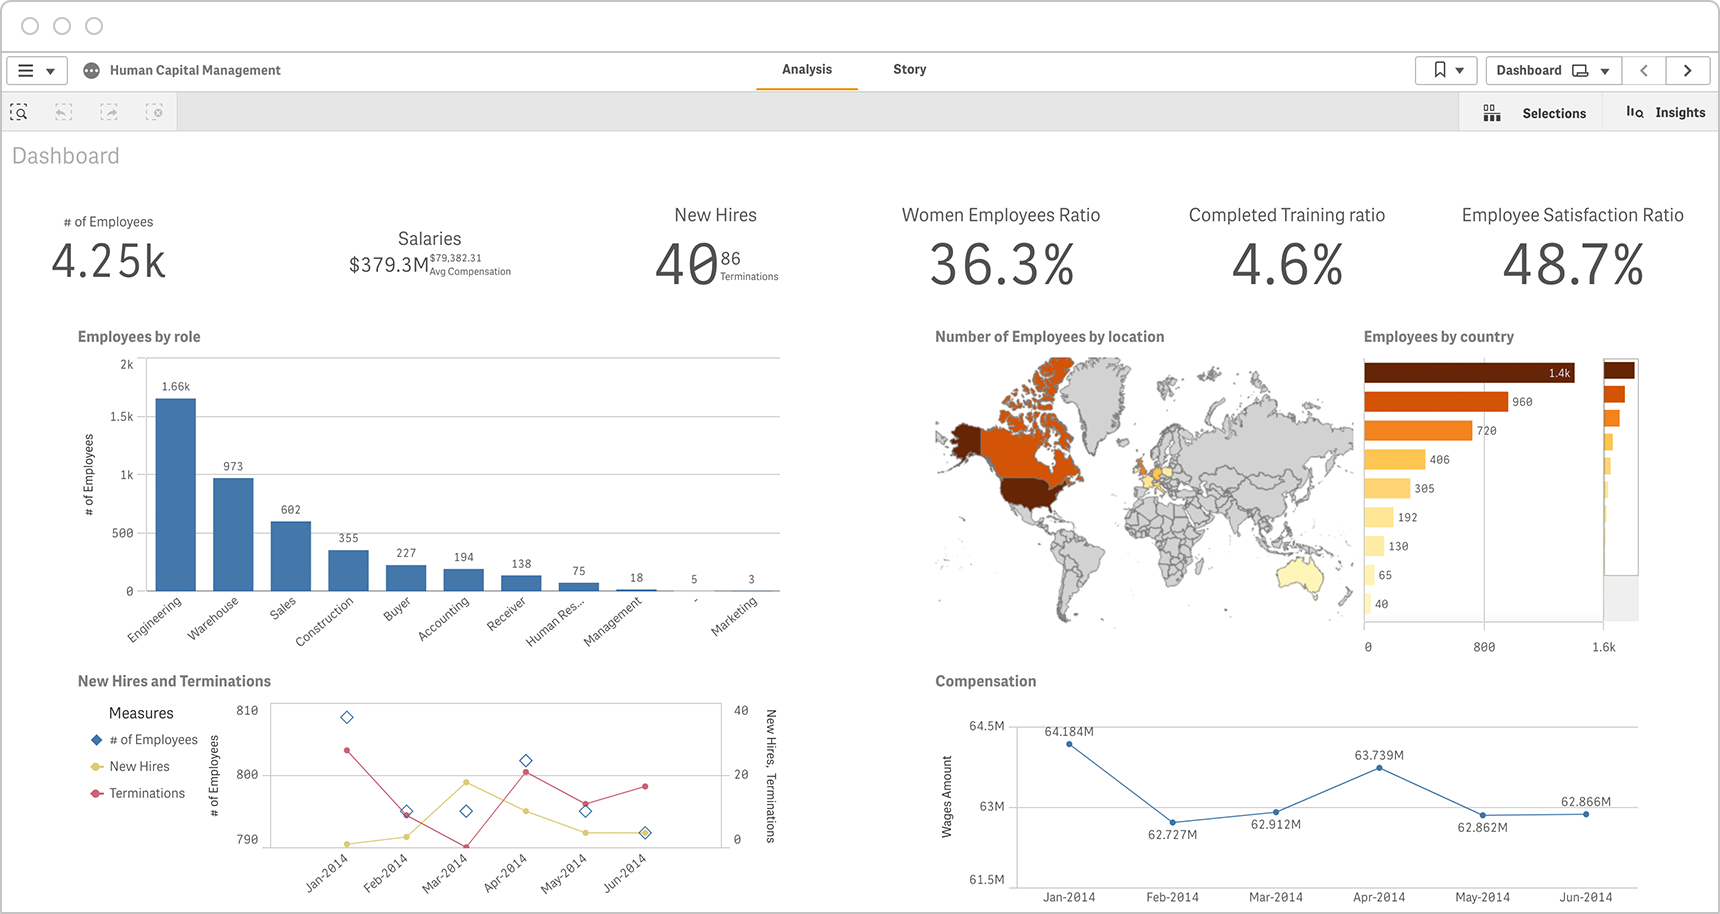
Human Resources
Modern people analytics makes it easy for HR executives to review and analyze all critical KPIs in a single location. The example here displays high-level metrics such as employees by role and by location, plus key data such as gender ratio and training progress. -
Marketing
Digital dashboards connect data from your CRM, advertising tools, and web analytics platform. Seeing and understanding each phase of the customer life cycle will help you boost your marketing ROI.
-
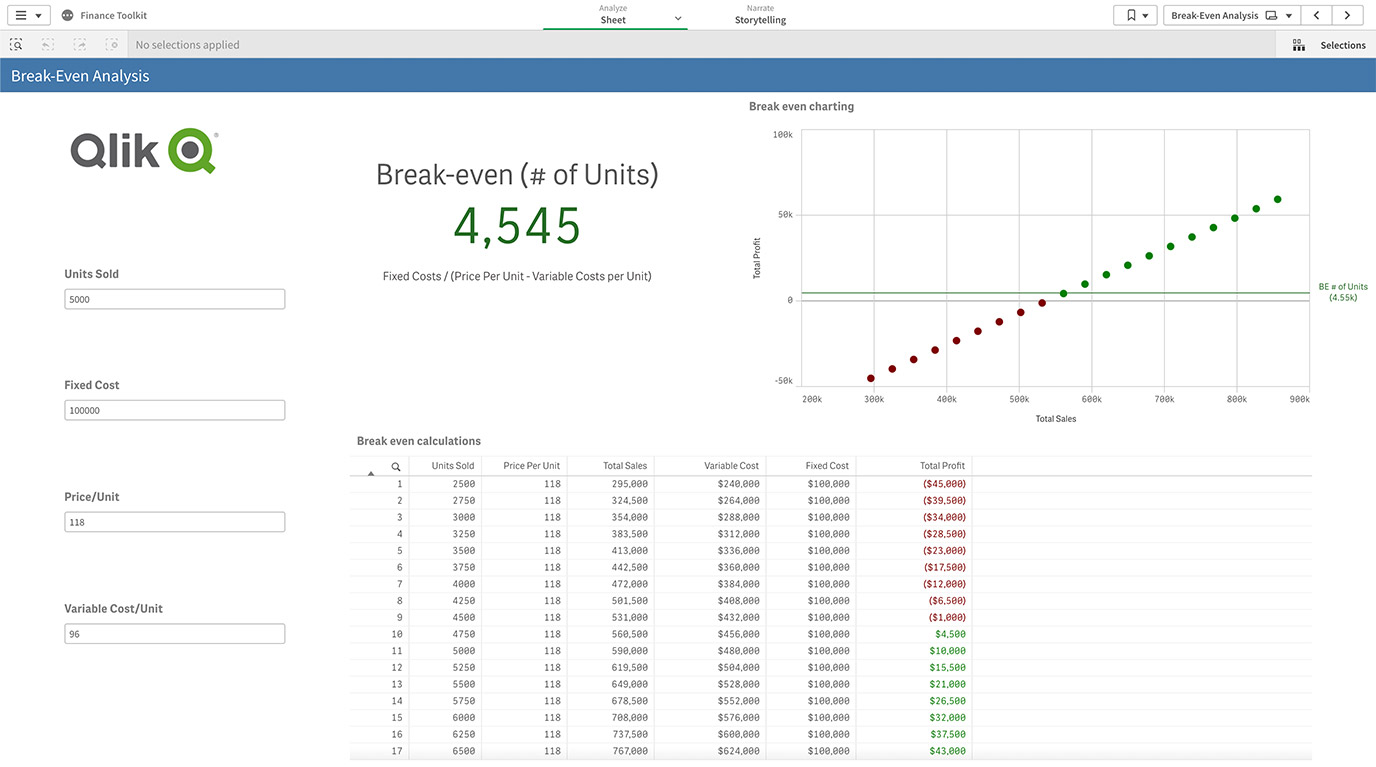
Finance
Effortlessly explore your procurement, contract and expense data, and discover innovative ways to manage costs, control risk, and increase profits. -
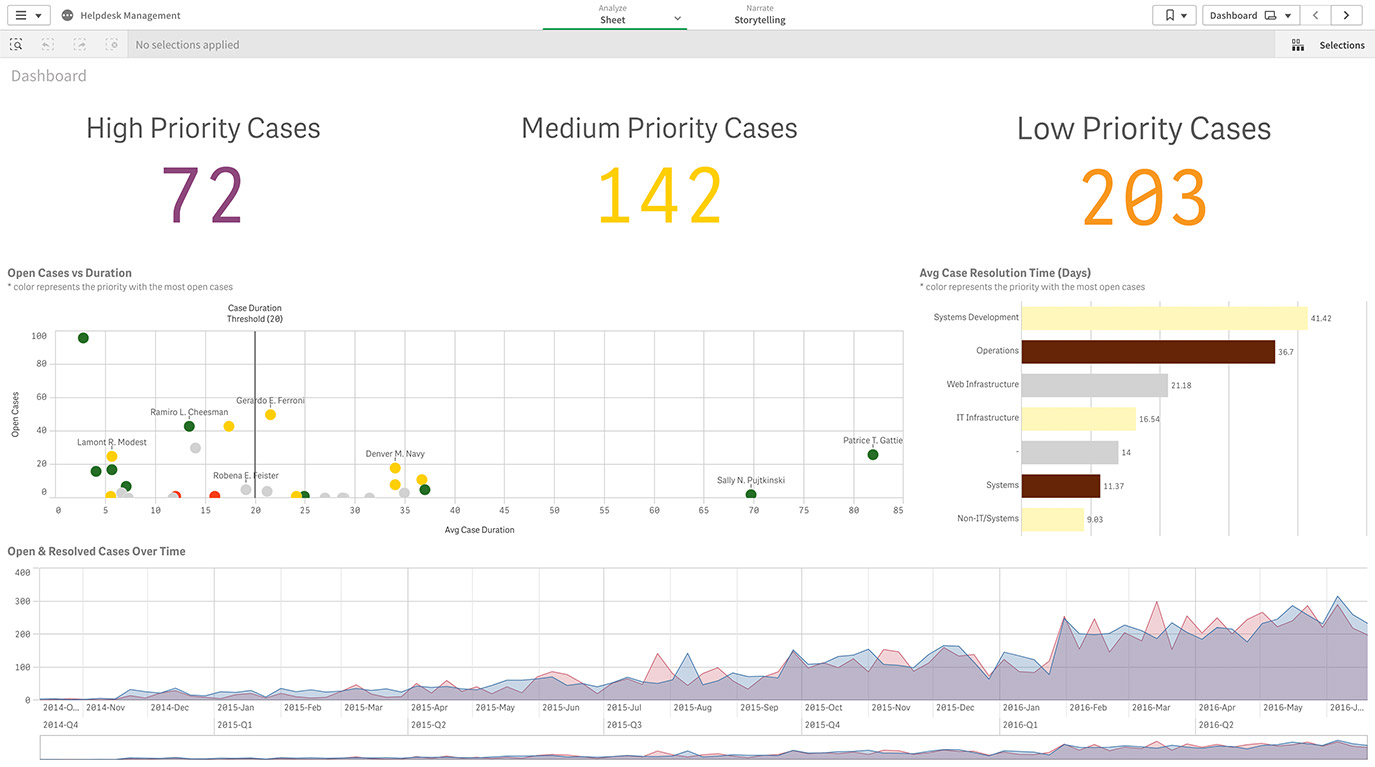
IT Digital Dashboard
Improve security, scalability and data governance through better data visualization. Identify underused systems and applications, and better anticipate upcoming technology needs. -
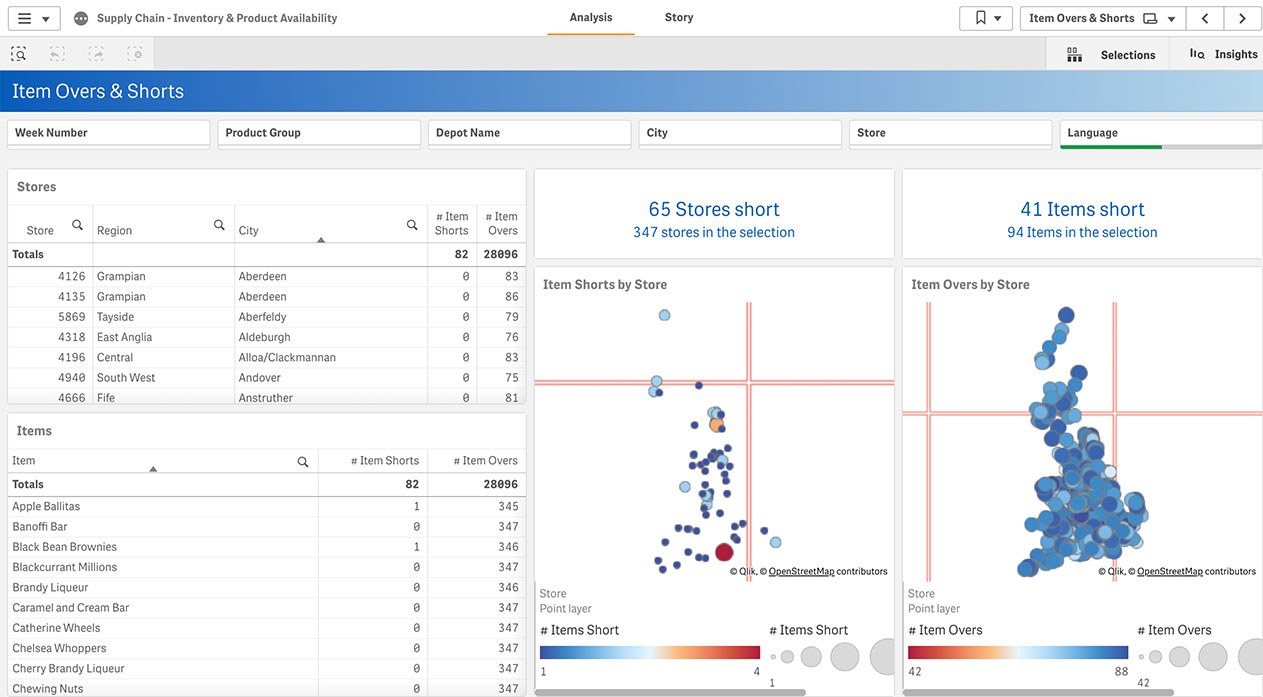
Supply Chain
An interactive digital dashboard can immediately surface KPIs that help you find connections between complex, disparate data sources. Use them to immediately improve supply chain performance, streamline planning, and keep a close watch on risks.
Download our ebook with 4 must-see dashboard examples.
Digital Dashboard Examples by Industry
Digital dashboards are indispensable tools for transforming your organization’s data into financial value, but there isn’t just one approach that works best for every business. To show you how targeted and versatile digital dashboards can be, we've gathered the following top-performing examples from specific industries.
-
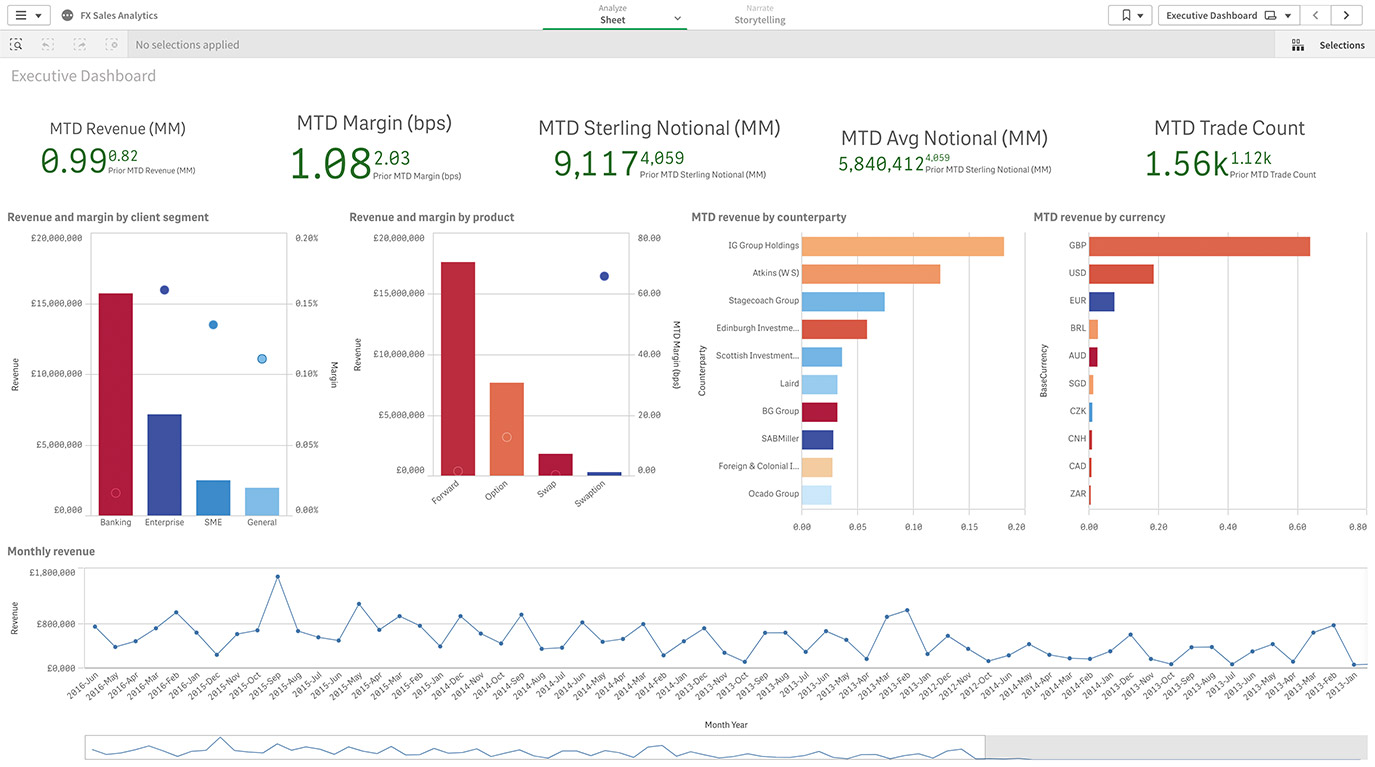
Financial Services
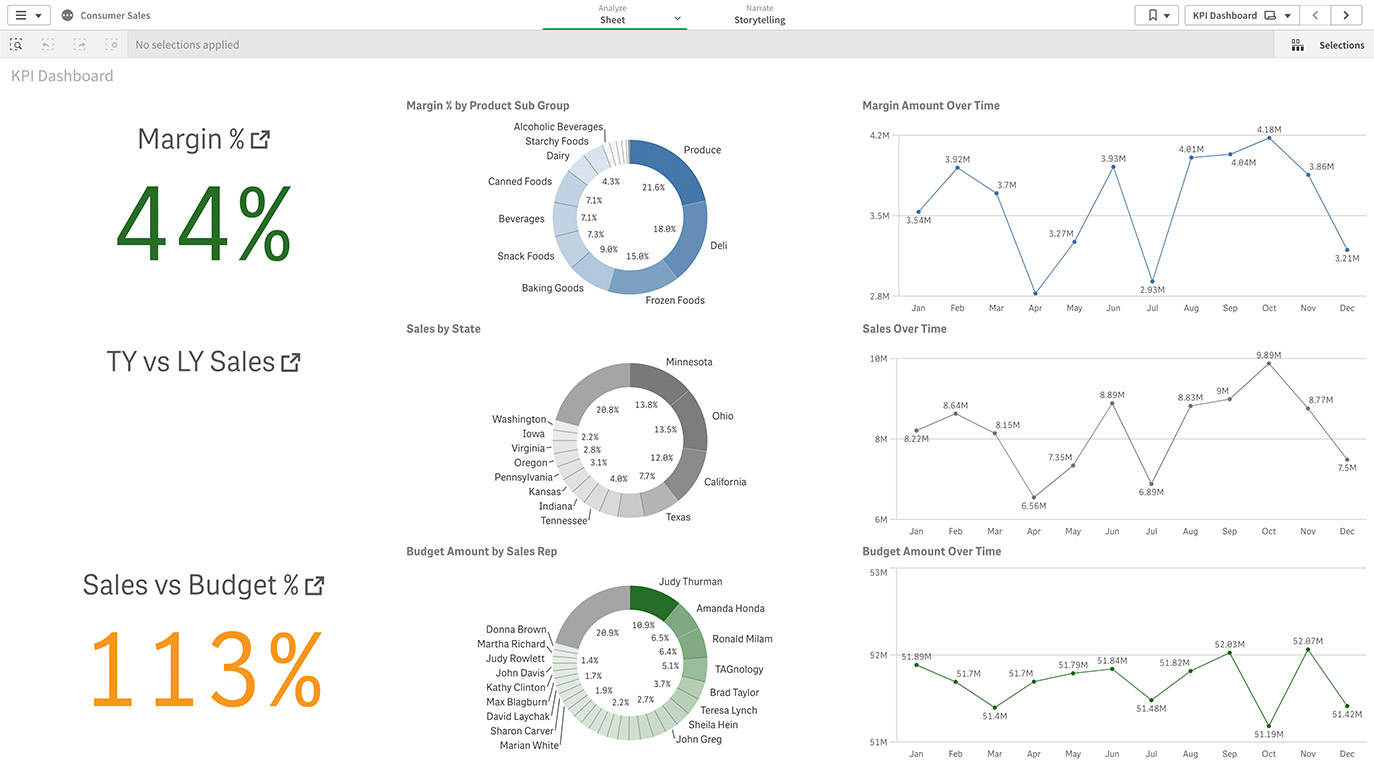
A custom dashboard for comparing revenue and margin data will help you identify your most profitable customers, spot ways to reduce operational costs, and find opportunities to transform your team's performance. -
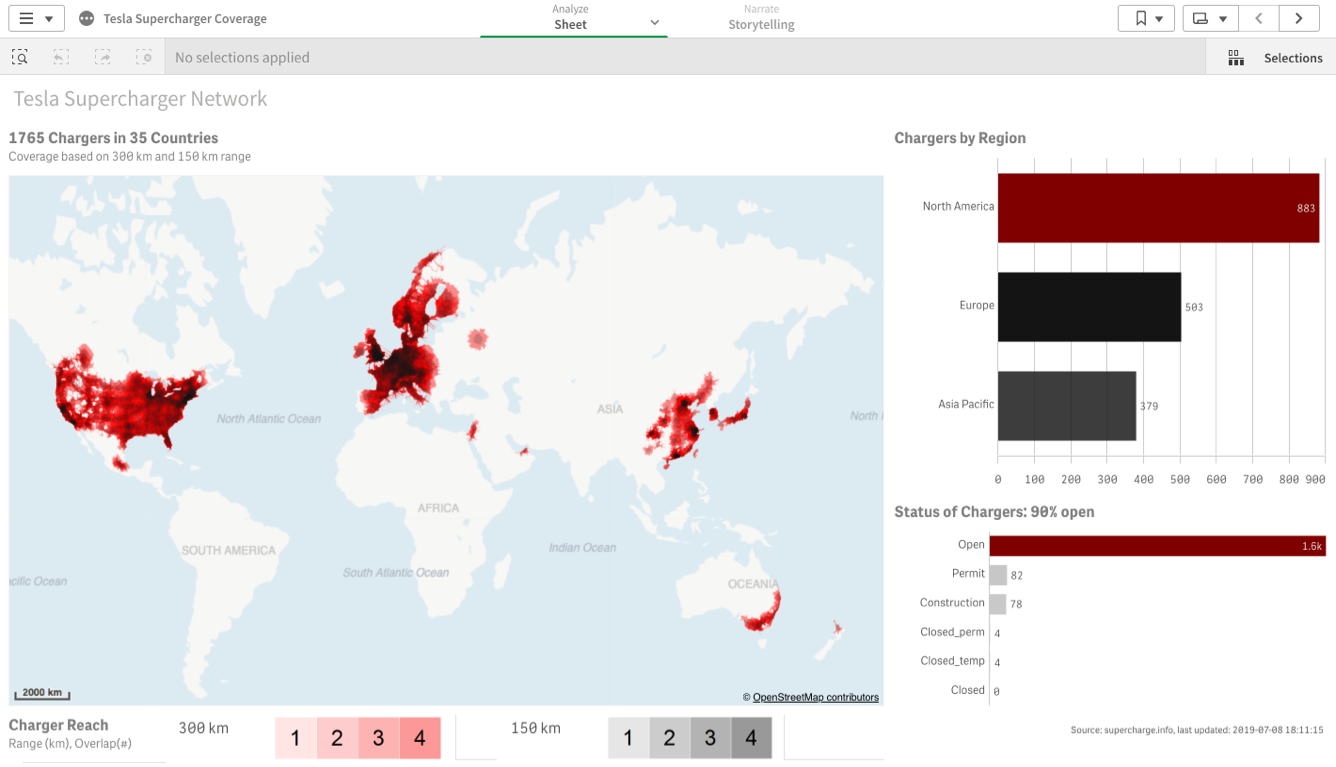
High Tech
Clear visualizations will help you gain visibility over your global supply chain, maximize profitability, accelerate innovation, and deliver far more agile operations. -
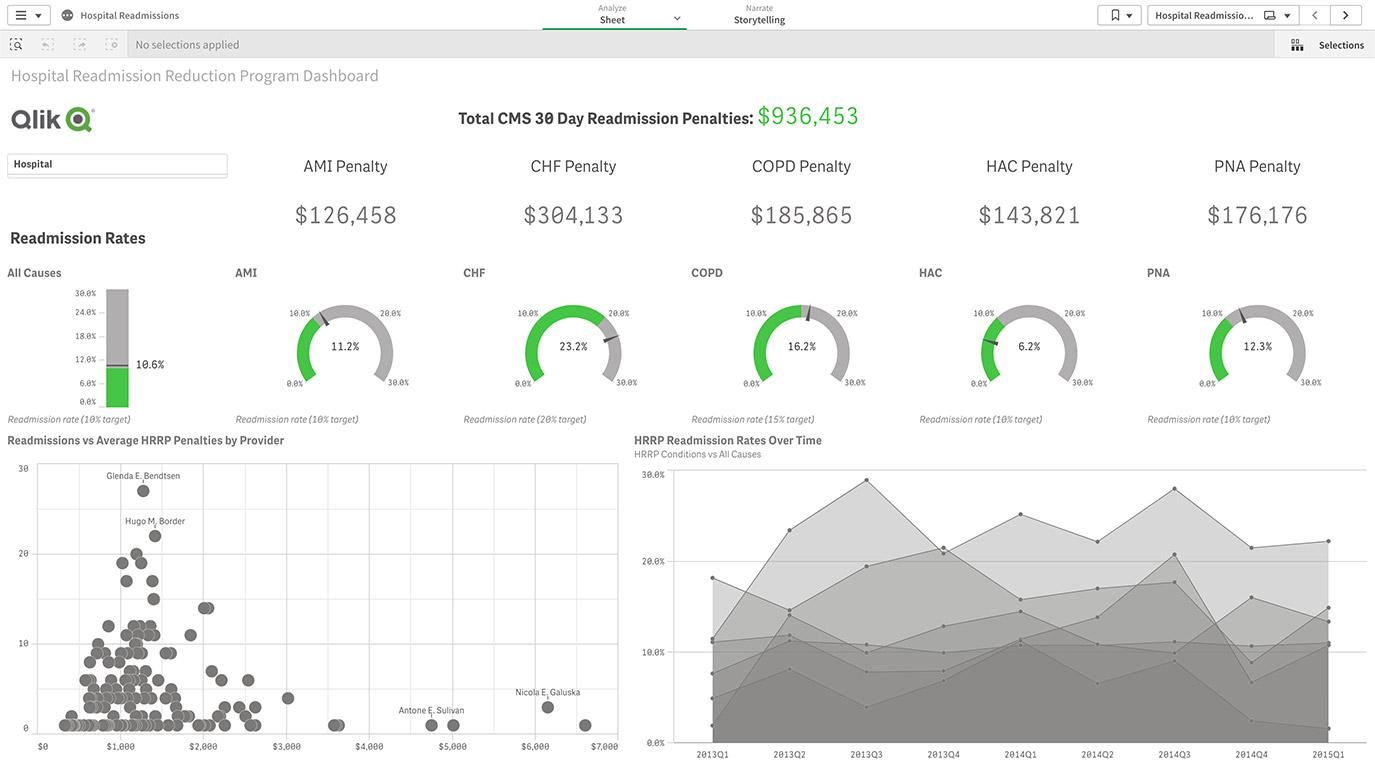
Healthcare
Healthcare digital dashboards allow you to quickly analyze important patient care KPIs to improve outcomes, discover operational inefficiencies, more effectively manage your workforce, and increase profitability.
-
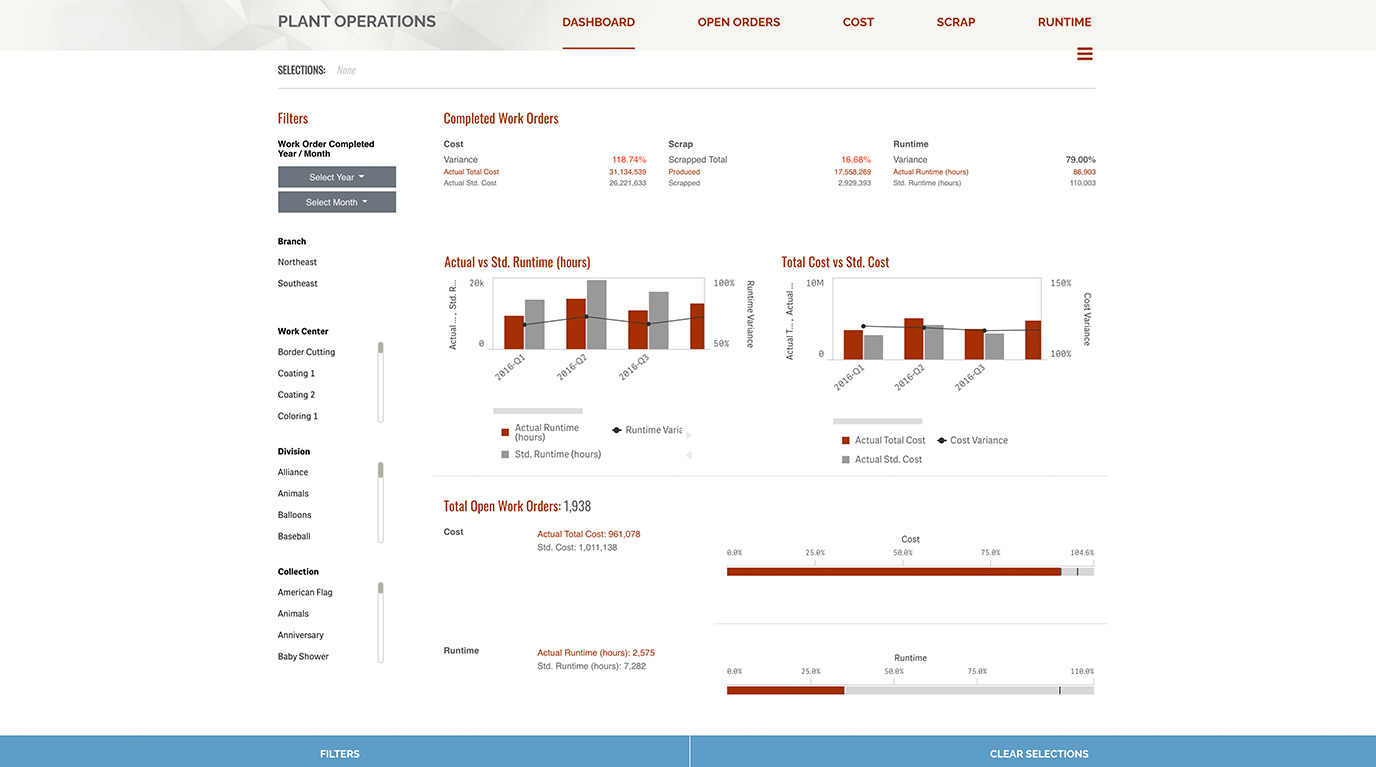
Manufacturing
A manufacturing dashboard lets you visualize the finest details of your plant operations, compare actuals against standards for your most important KPIs, and find unexpected supply-chain and operational efficiencies. -
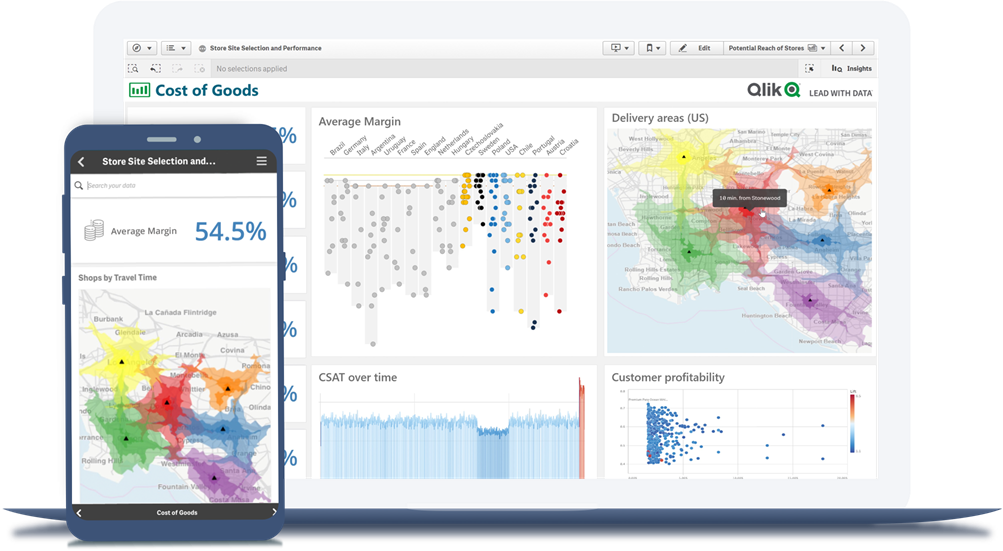
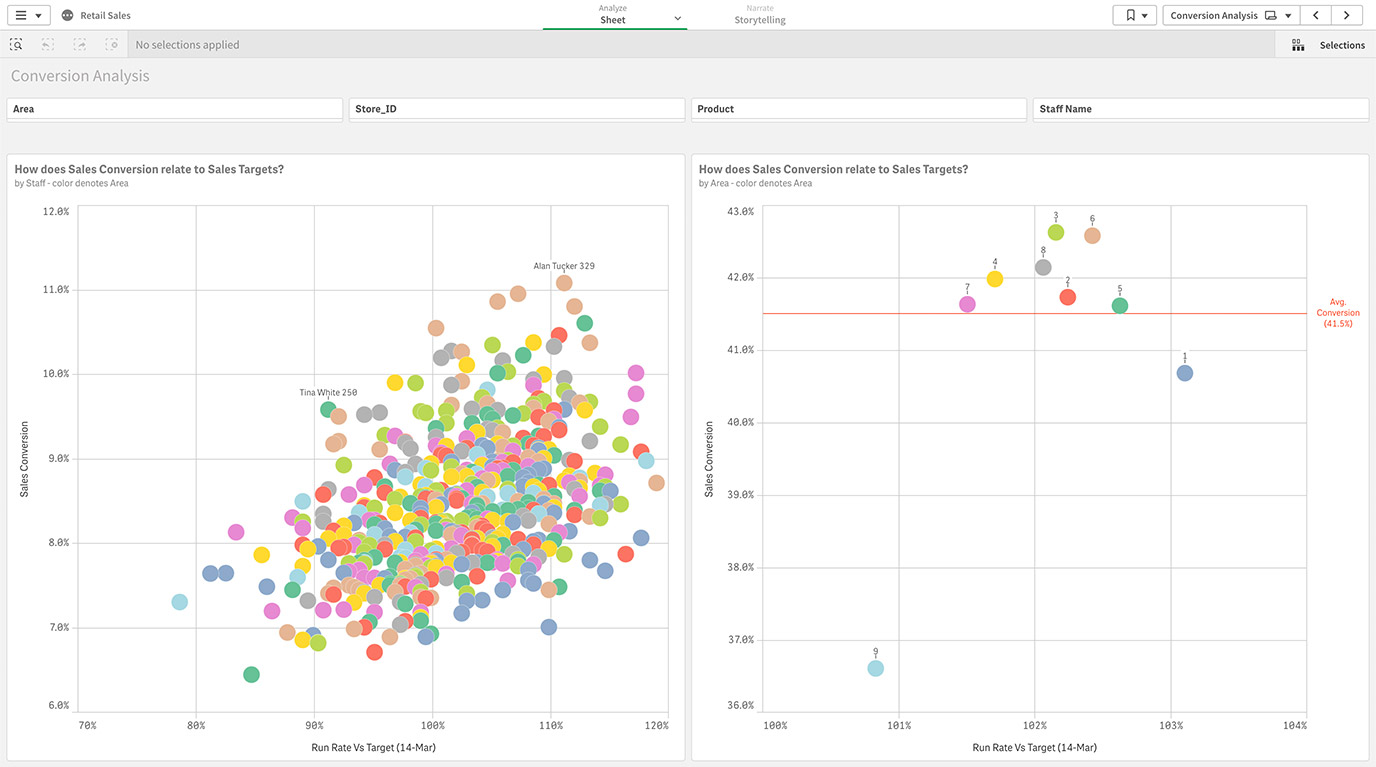
Retail
View your most important KPIs in one location. Leverage the data to analyze shopping patterns by channel, drive sales and shopper engagement, and maximize profit. -
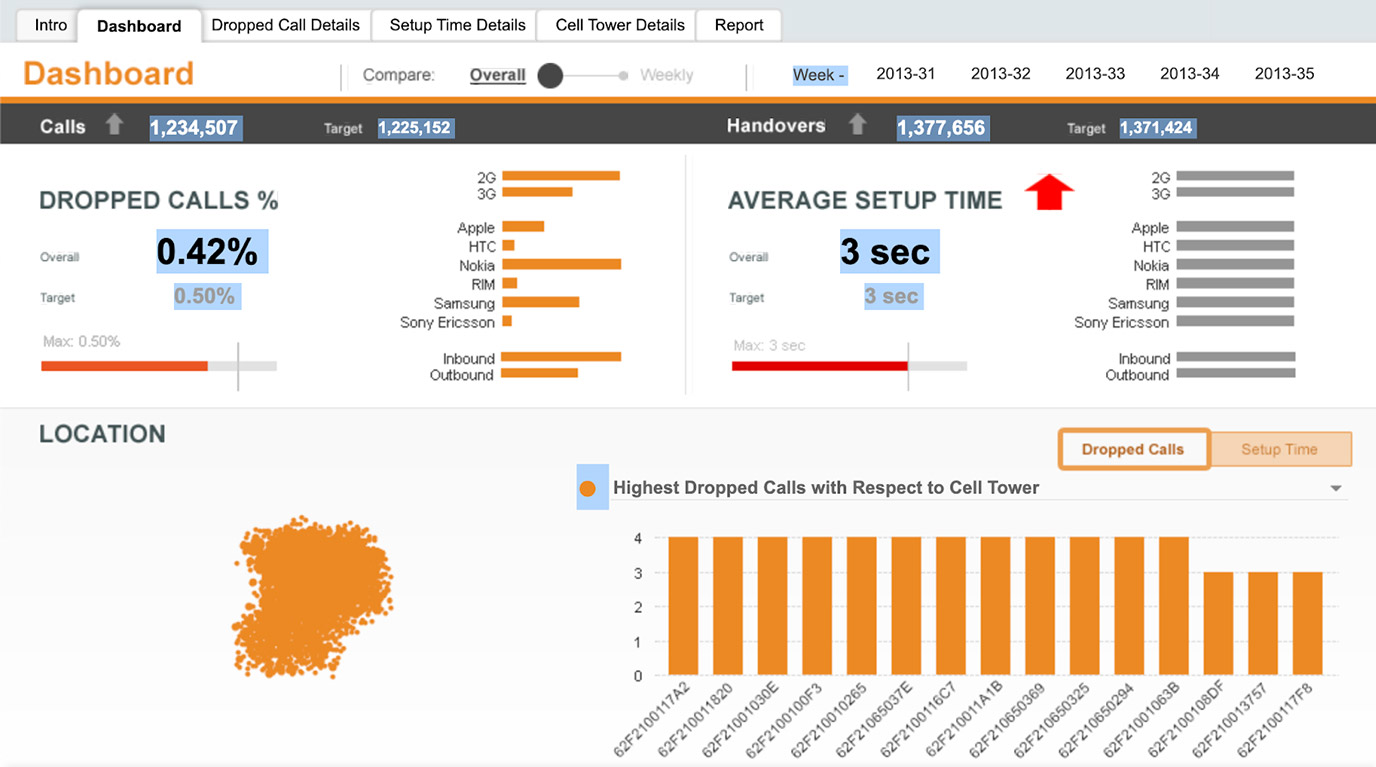
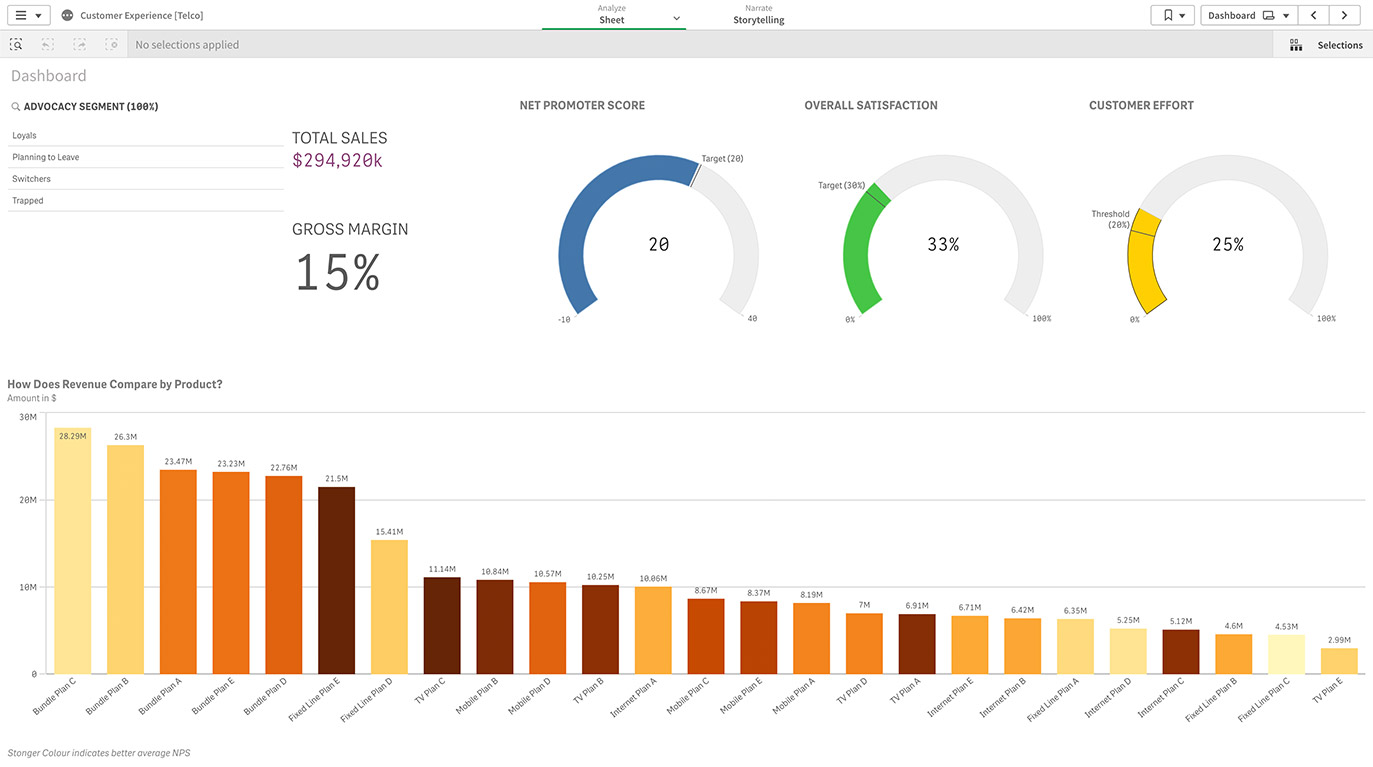
Media & Telecom
Immediately view KPIs that help you navigate fluctuating markets, centralize your processes, and improve customer loyalty.
-
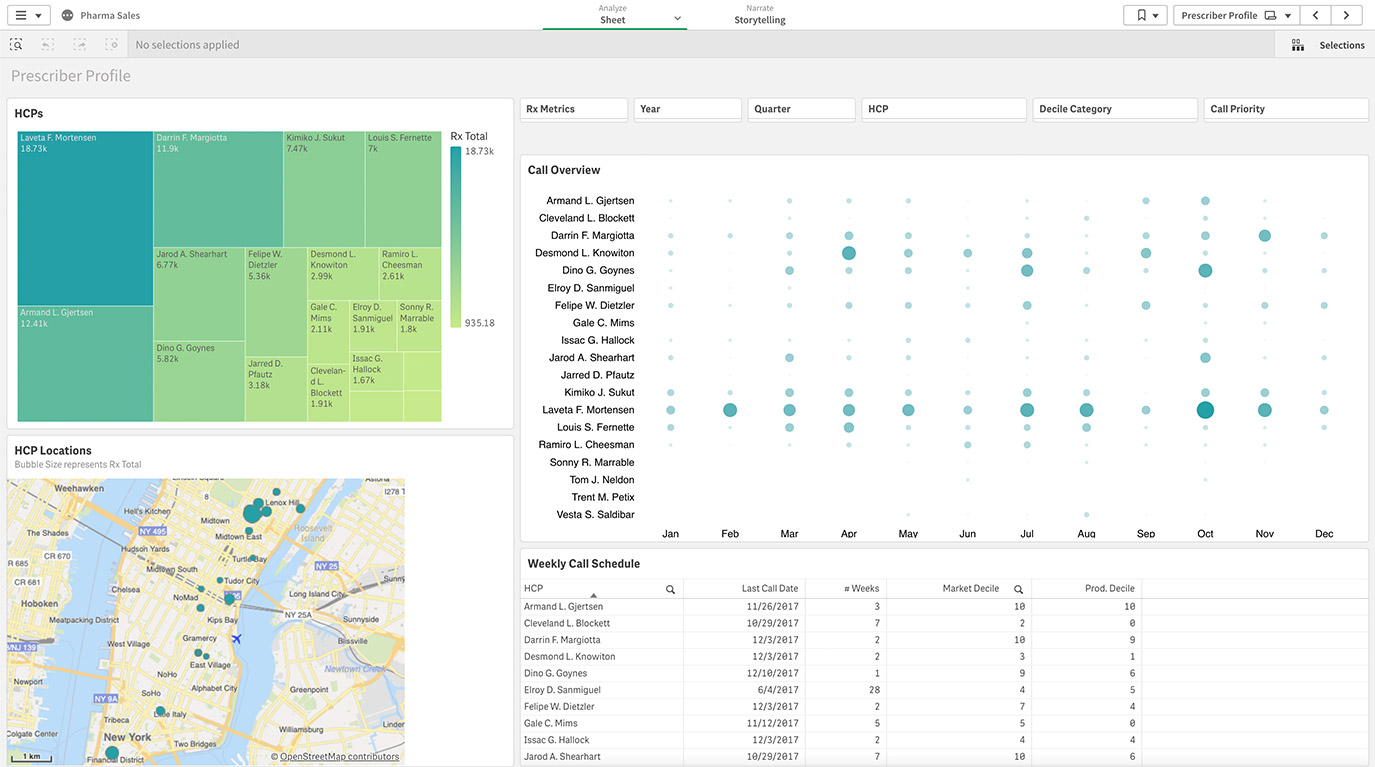
Life Sciences
Digital dashboards let you easily explore and combine your CRM data with market share data, letting you adapt quickly to change and target customers more effectively. -
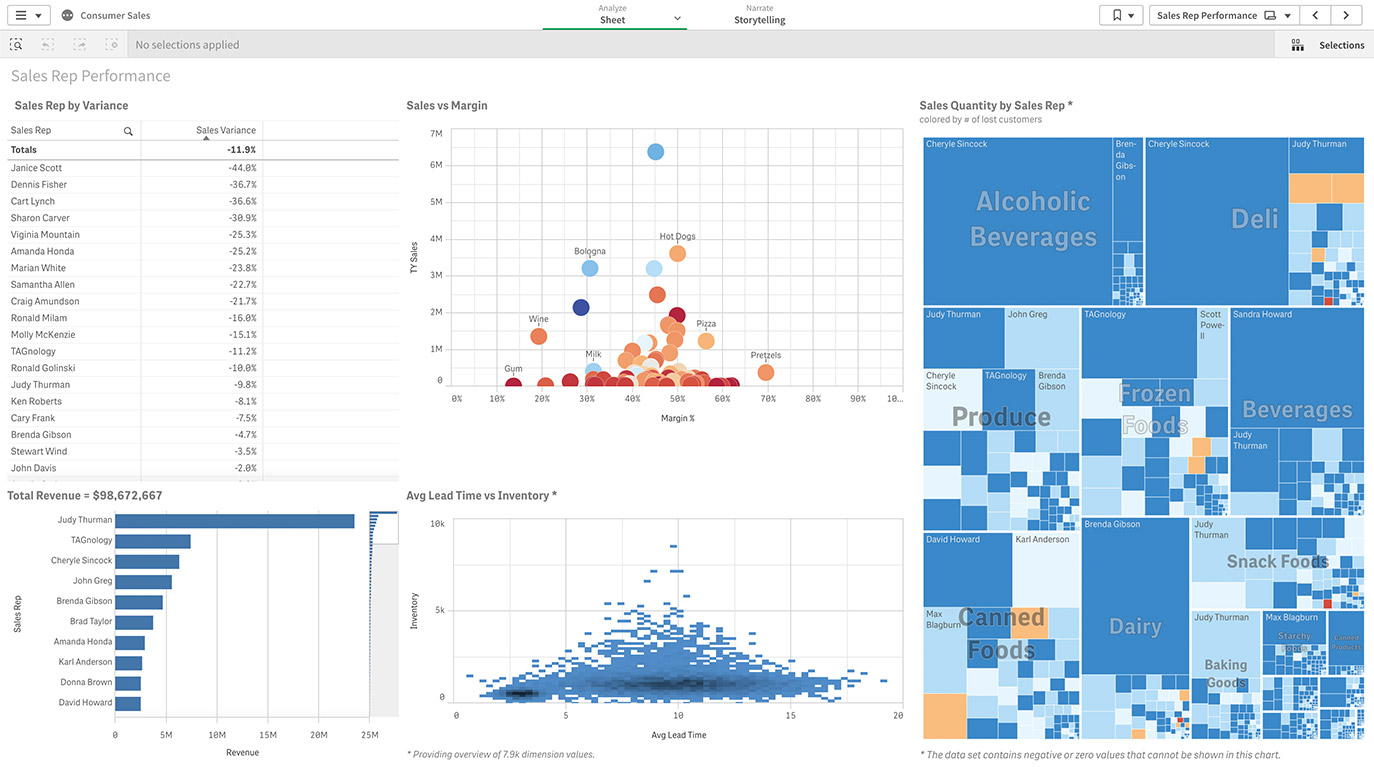
Consumer Products
Analyze consumer trends in a single view to help you maximize sales, increase market share and consumer loyalty, and manage intelligent supply chains.
Inspire action with your data. Learn about the latest visualizations and how to choose the right ones to highlight the most important aspects of your data.
Best Practices for Digital Dashboards
Before you jump in to build your own digital dashboards, be sure to consider the following best practices so you can start off on the right foot.
Understand your dataTake the time to discover all the data that's available to you, the most important information you'll need to report on, and the types of decisions you want the data to inform.
Enable your teamItemize the top goals for key stakeholders on your team, and use this knowledge to prep dashboards that help them take the most impactful actions.
Simplify your visualsDigital dashboards are powerful tools, but including too many complex visualizations can hinder quick insights. Explore different designs until you have a dashboard that presents your stories in a clean, simple way. Get inspired by the ten best modern data visualization examples.
Free your usersDon't limit users to linear exploration — let people freely explore all connections within the data, so they can discover the full story for themselves.
Provide the right data for the right usersGuide users to better, faster insights by giving them access to the data that's most relevant to their individual roles.
Embed dashboards where decisions are madeLet your users explore their data wherever they make decisions — apps, business processes, portals and websites.
In BARC’s survey of real BI users, Qlik Sense ranked #1 in critical KPIs including Performance Satisfaction, Dashboards, and Project Length in its peer groups.
Key Capabilities of a Digital Dashboard
The most effective digital dashboards do so much more than just KPI tracking and data visualization. Here are a few key capabilities to consider as you find the right dashboard tool for you:
- Fully interactive. Leverage robust analytics right from the dashboard itself to explore and evaluate your data.
- All data sources, together. Easily combine and analyze data from across the organization.
- Augmented Analytics (AI). Powerful AI will suggest specific analyses to perform, and insights to glean from your data.
- Automated Alerts and Reporting. Set up your dashboard to auto-share with key stakeholders on a regular cadence, and to send alerts based on KPI fluctuations.
- Built for Mobile. Dive into your dashboards from any device, with full touchscreen optimization and interactive functionality.
- Simple Data Prep. A digital dashboard connected to a modern data analytics platform will help you to spend less time preparing data, and more time pinpointing ways to better manage your team.