KPI Examples and Templates
Find the right KPIs for your business. This guide provides examples, templates and practical advice to help you define the key performance indicators that matter most for your organization and teams.
KPI Examples Guide
What is a KPI?
Let’s start with the basics. A key performance indicator (KPI) is a quantifiable measure of performance over time for a specific strategic objective. Business leaders and senior executives use KPIs to judge the effectiveness of their efforts and make better informed decisions.
KPIs vs Metrics
What’s the difference between a KPI and a metric?
- KPIs represent how you’re performing against strategic goals. And by goals, we mean specific business outcomes, such as targeted quarterly revenue or targeted new customers per month.
- Metrics support KPIs by representing the tactical processes or actions necessary to achieve the KPIs. Metrics track and measure the success against targets for specific actions such as monthly brochure downloads or store visits.
- Dive deeper on the question, “What is a KPI?”
- Design your own interactive KPI Dashboard

Don’t just measure. Measure what matters.
Download the KPI Planning Guide to learn:
- 10 steps to strong KPIs
- Which questions help you define your KPIs
- 170 KPI examples and templates
170 KPI Examples And Templates
In this guide, we’ve identified and prioritized the most impactful key performance indicators examples for each department. Use the table of contents below to find the KPI examples most relevant to your organization and teams.
Sales KPI Examples
Sales leaders and their teams need to track the key performance indicators that help them close more orders. Below are the 15 essential sales KPI examples:
-
- New Inbound Leads
- Lead Response Time
- Lead Conversion %
- New Qualified Opportunities
- Total Pipeline Value
-
- Lead-to-Opportunity %
- Opportunity-to-Order %
- Average Order Value
- Average Sales Cycle Time
-
- Upsell %
- Cross-Sell %
- Sales Volume by Location
- Sales Change (YoY, QoQ. MoM)
- Sales Target %
KPIs for Managers
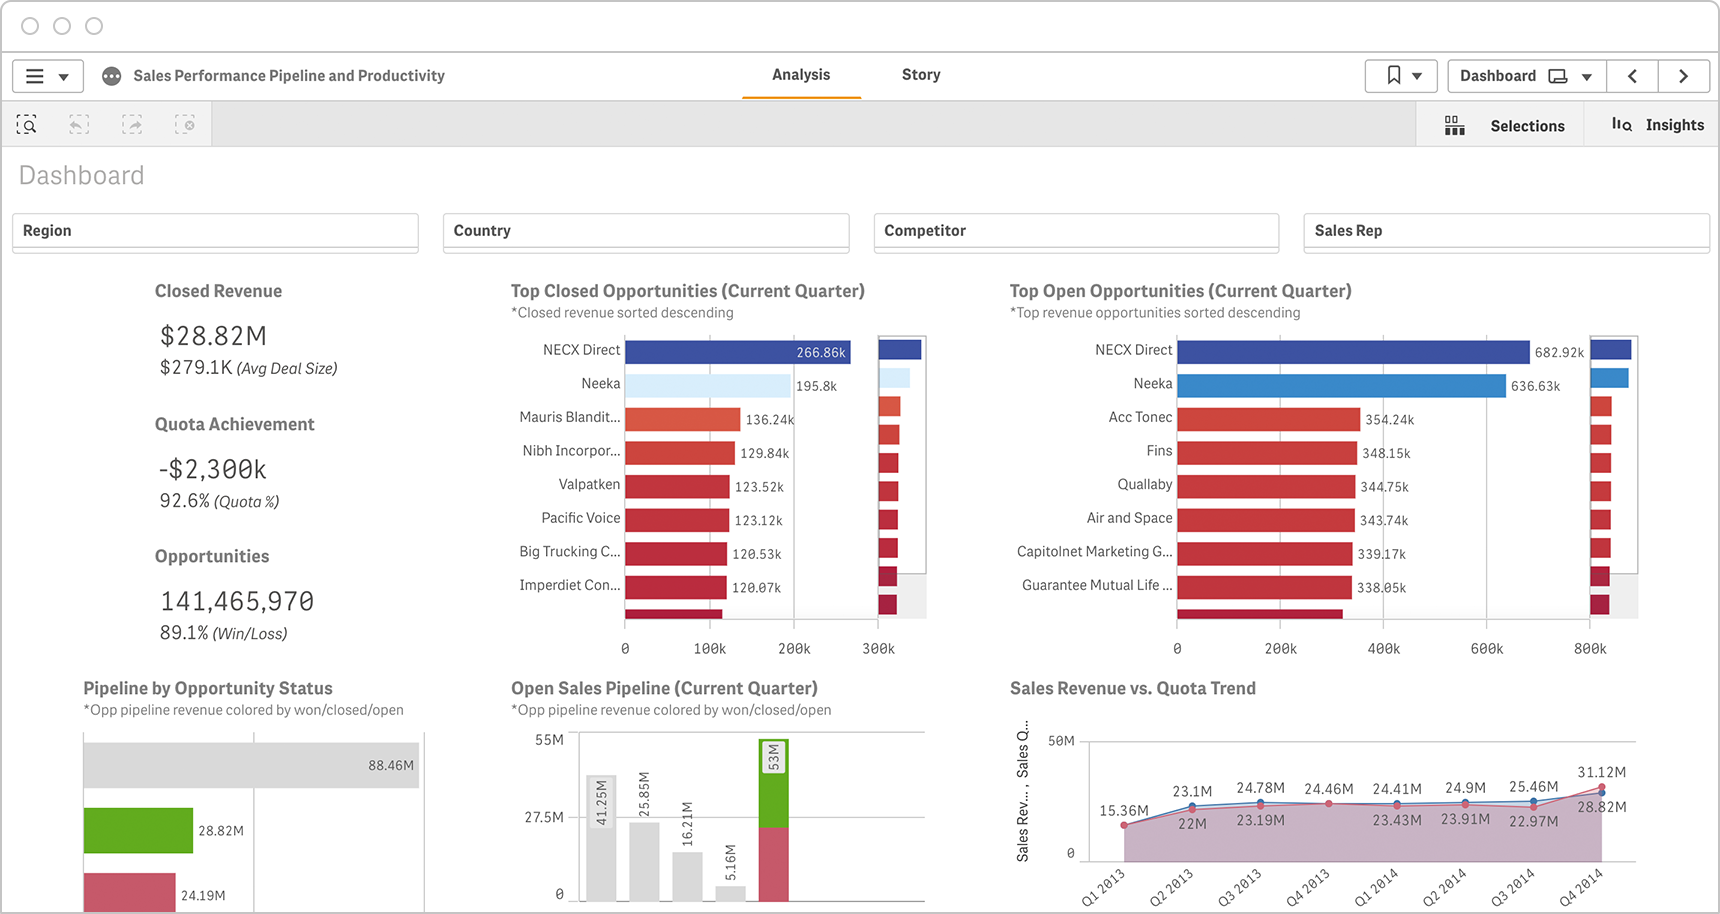
Executives and managers need KPIs that reflect their organization’s strategic priorities. Below are the 15 key management KPI examples:
-
- Customer Acquisition Cost
- Customer Lifetime Value
- Customer Satisfaction Score
- Sales Target % (Actual/Forecast)
- Sales by Product or Service
-
- Revenue per FTE
- Revenue per Customer
- Operating Margin
- Gross Margin
- ROE (Return on Equity)
-
- ROA (Return on Assets)
- Current Ratio (Assets/Liabilities)
- Debt to Equity Ratio
- Working Capital
- Employee Satisfaction Rating
Project Management KPIs
Project managers need to keep projects on time and on budget while also ensuring a high quality outcome. That’s why the 15 key performance indicators examples below focus on timeliness, budget and quality.
-
- On-Time Completion %
- Milestones on Time %
- Estimate to Project Completion
- Adjustments To Schedule
- Planned vs. Actual Hours
-
- Resource Capacity %
- Budget Variance (Planned vs Actual)
- Budget Iterations
- Planned Value
- Net Promoter Score
-
- Number of Errors
- Customer Complaints
- Change Requests
- Billable Utilization
- Return On Investment (ROI)
Inspire Action With Your KPIs
10 ways to take your data visualizations to the next level. Learn how to choose the right ones to highlight your KPIs and metrics.
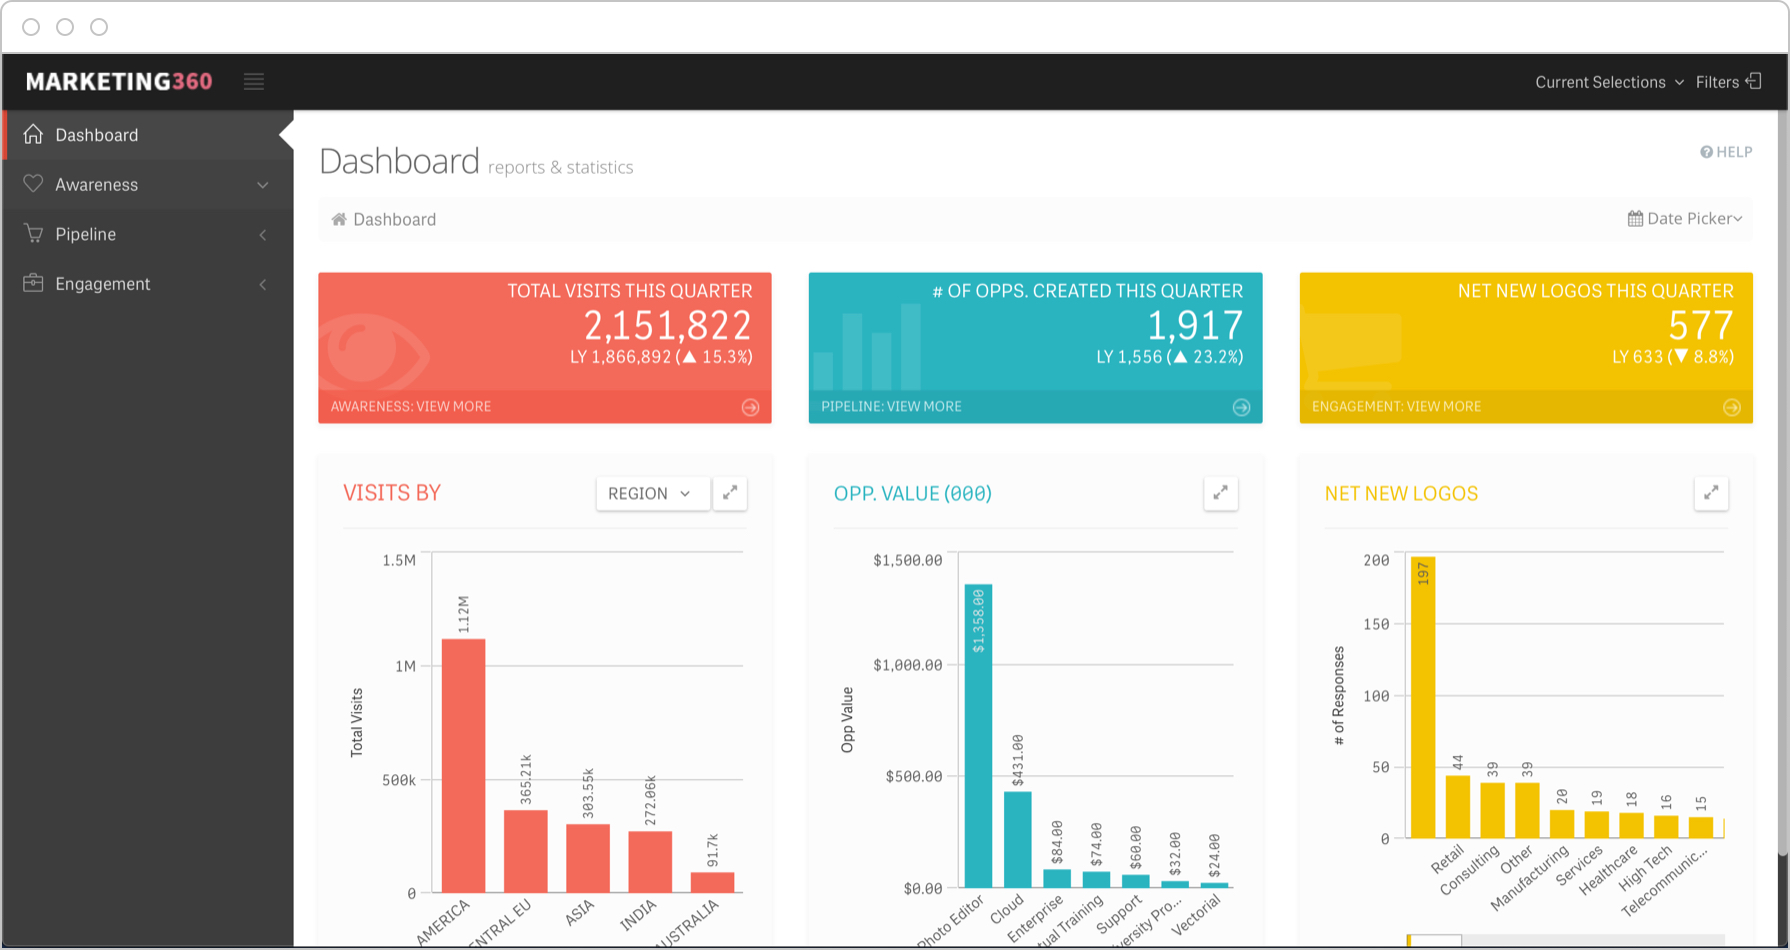
Marketing KPIs
Marketing leaders need to track KPIs which enable them to measure their progress against clearly defined goals. The 15 marketing KPI examples below cover all phases of the customer funnel and can be accurately tracked using modern marketing analytics.
-
- Marketing Qualified Leads (MQLs)
- Sales Qualified Leads (SQLs)
- Cost per Lead
- New Customers
- Cost per Acquisition
- Upsell & Cross-Sell Rates
-
- Conversion Rates (For Specific Goals)
- Social Program ROI (By Platform)
- Organic Traffic & Leads
- Return on Ad Spend (ROAS)
- Average Order Value
-
- Total Revenue
- Revenue by Product or Service
- Customer Lifetime Value (CLV)
- Net Promoter Score (NPS)
Learn more about Marketing KPIs
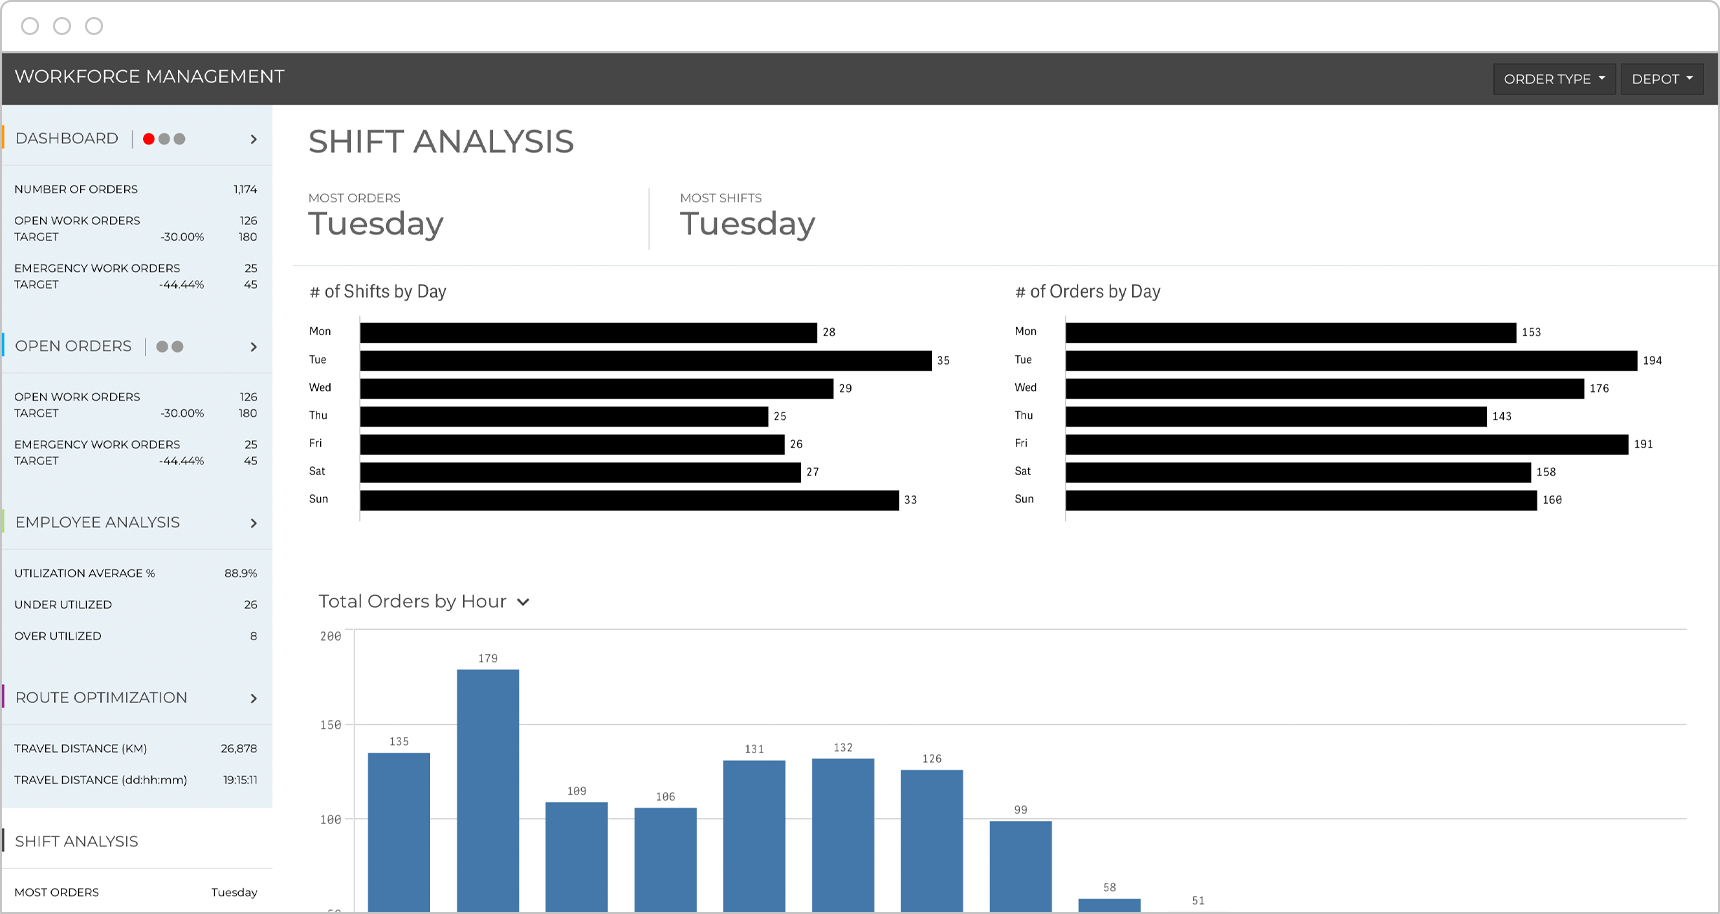
Operations KPIs
Operations managers need to track KPIs around efficiency, effectiveness and quality as covered in the 15 key performance indicators examples below.
-
- Labor Utilization
- Employee Turnover Rate
- Employee Absence Rate
- Employee Training Rate
- ROI of Outsourcing
-
- Labor Materials
- Operating Margins
- Customer Lifetime Value
- Processes and Procedures Developed
- Cash Flow
-
- Project Schedule Variance
- Order Fulfilment Cycle Time
- Delivery In Full On Time Rate
- Rework Rate
- Customer Complaints
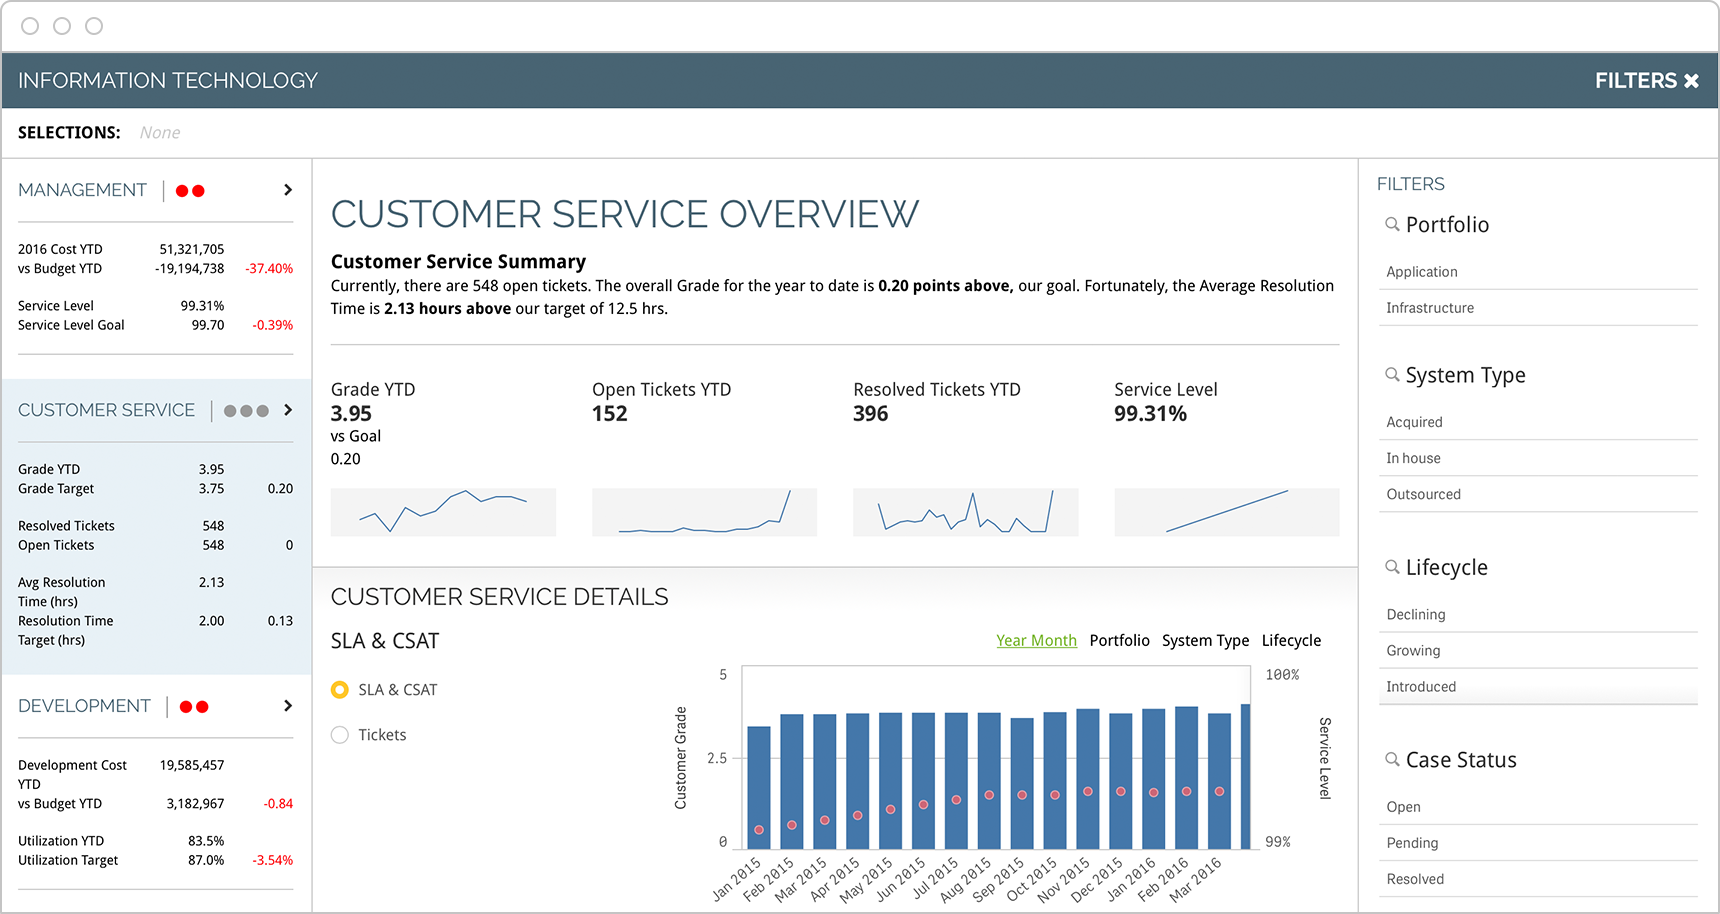
Customer Service KPIs
Service and support teams should focus on KPIs that measure response times. But, like the 15 key performance indicators examples below, they should also have a clear view of the customer base and longer term, preventative KPIs such as employee engagement and knowledge base articles.
-
- Number of Issues (By Type)
- First Response Time (FRT)
- First Contact Resolution Rate
- Average Response Time
- Average Resolution Time
-
- Most Active Support Agents
- Cost Per Conversation
- Customer Satisfaction Score (CSAT)
- Net Promoter Score (NPS)
- Positive Customer Reviews
-
- Customer Effort Score
- Customer Retention Rate
- Support Costs / Revenue Ratio
- Knowledge Base Articles
- Employee Engagement
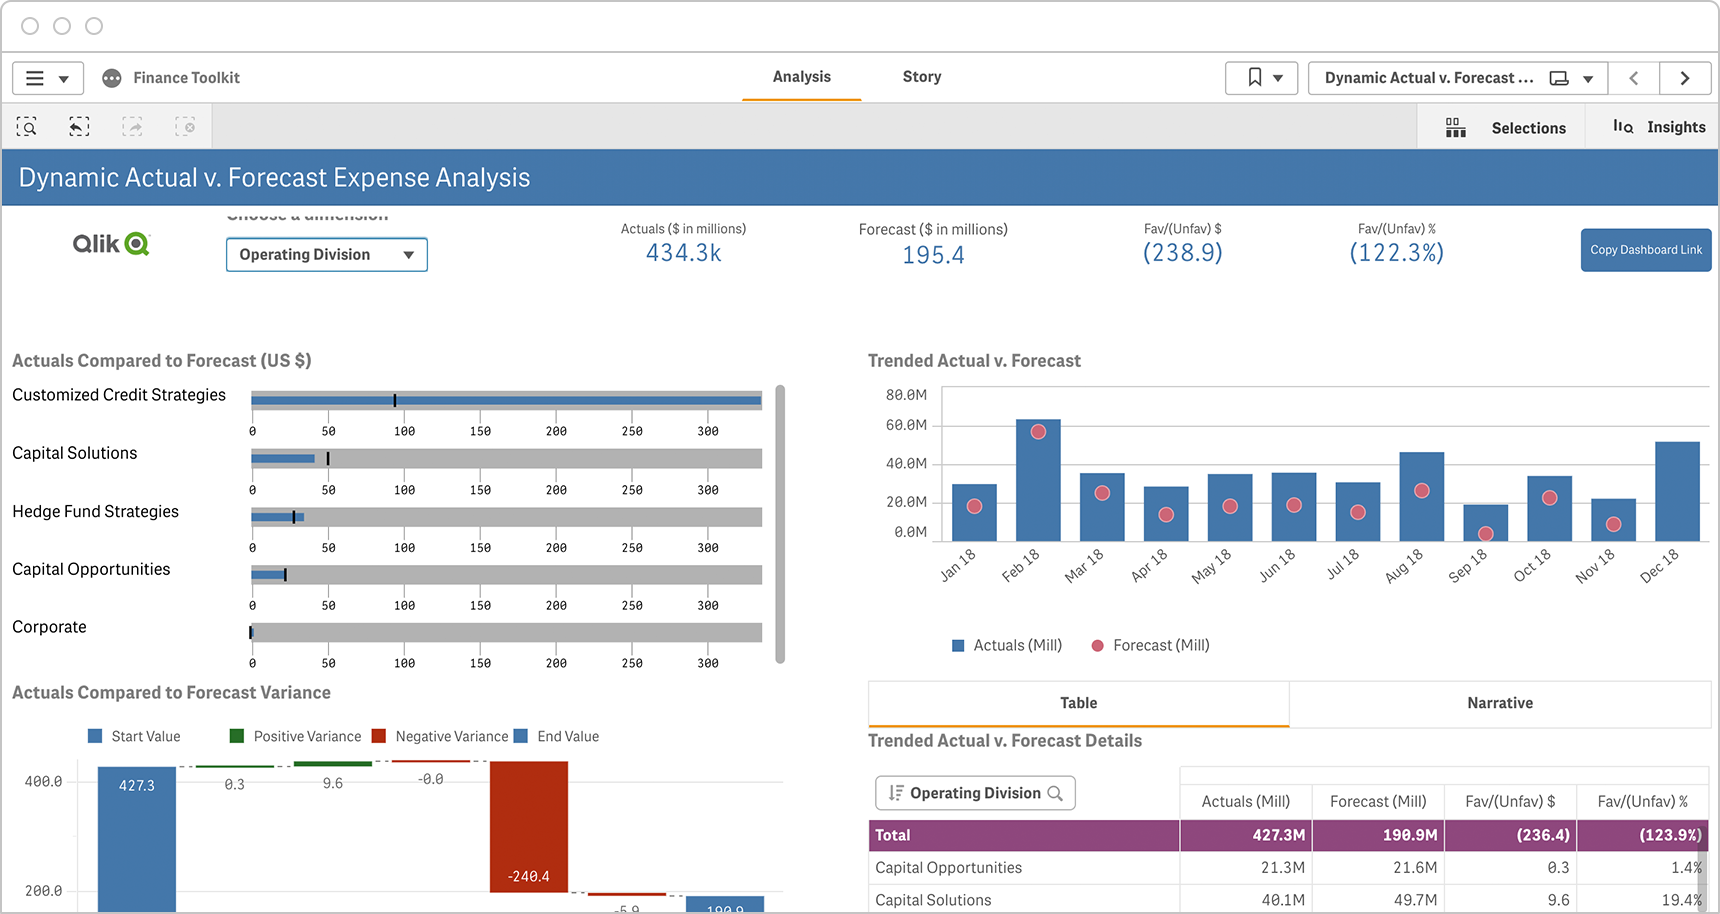
Finance KPIs
Financial teams have no shortage of ratios and metrics to track. Finance managers and CFO’s should use a financial analytics tool to focus on margin, expense, revenue and cash management as shown in the 15 key finance KPI examples below.
-
- Gross Profit Margin (and %)
- Operating Profit Margin (and %)
- Net Profit Margin (and %)
- Operating Expense Ratio
- Working Capital Ratio
-
- Debt-To-Equity Ratio
- Quick Ratio (Acid Test)
- Current Ratio
- Berry Ratio
- Return on Assets
-
- Cash Conversion Cycle
- Accounts Payable Turnover Ratio
- Accounts Receivable Turnover Ratio
- Budget Variance
- Payroll Headcount Ratio
Human Resources KPIs
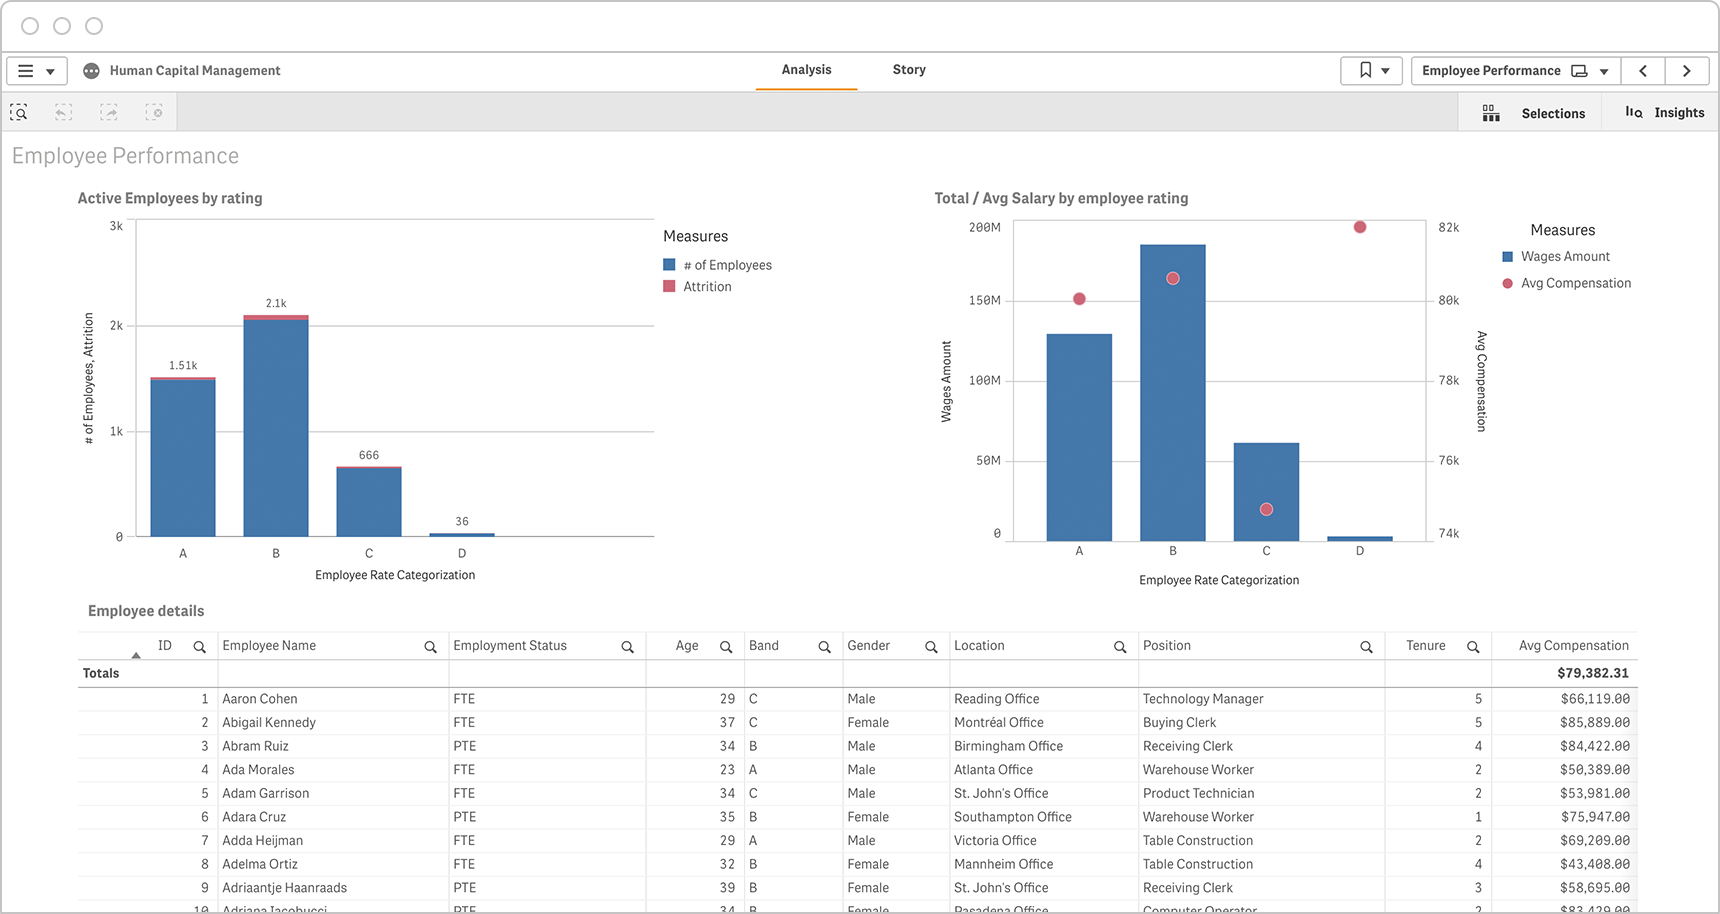
HR managers are primarily concerned with 3 main areas: workforce management, compensation and recruitment. You can use a people analytics tool to track and analyze the 35 key performance indicators examples below:
-
Workforce Management KPIs:
- Absenteeism rate
- ROI of outsourcing
- Succession planning rate
- Open/closed grievances
- Promotion rate
- Time to productivity
- Successor gap rate
- Worker composition by gender, experience, and tenure
- Internal mobility
- Manager quality index
- HR effectiveness
- Employee satisfaction rates
- Training ROI
-
Compensation KPIs:
- HR functional operating expense rate
- Labor cost per FTE
- Labor cost revenue percent
- Labor cost revenue expense percent
- Total benefits as percentage of labor costs
- Revenue per FTE
- Profit vs. compensation per FTE
- Human capital ROI
- HR functional cost per employee
-
Recruitment KPIs:
- Quality of hire
- Vacancy rate
- Turnover rate
- Resignation/retirement rate
- External hire rate
- Time-to-fill
- Diversity, experience, and gender hire ratio
- Recruiting funnel metrics
- Talent import/export ratio
- Voluntary turnover rate
- Retention rate
- Recruiting expense per new hire
- Retirement rate forecast
IT KPIs
IT managers should track the on-going stream of support tickets and downtime. They should also track the projects and the team that will proactively reduce the number of these tickets in the future as shown in the top-15 IT KPI examples below.
-
- Total Support Tickets
- Open Support Tickets
- Ticket Resolution Time
- Reopened Tickets
- Average Time Between Failures
-
- Average Time to Repair
- Uptime %
- Server Downtime
- Security Related Downtime
- Total Projects
-
- Projects on Budget
- Critical Bugs
- IT Support Employees Per End Users
- IT Costs vs Revenue
- IT Team Turnover

Social Media KPIs
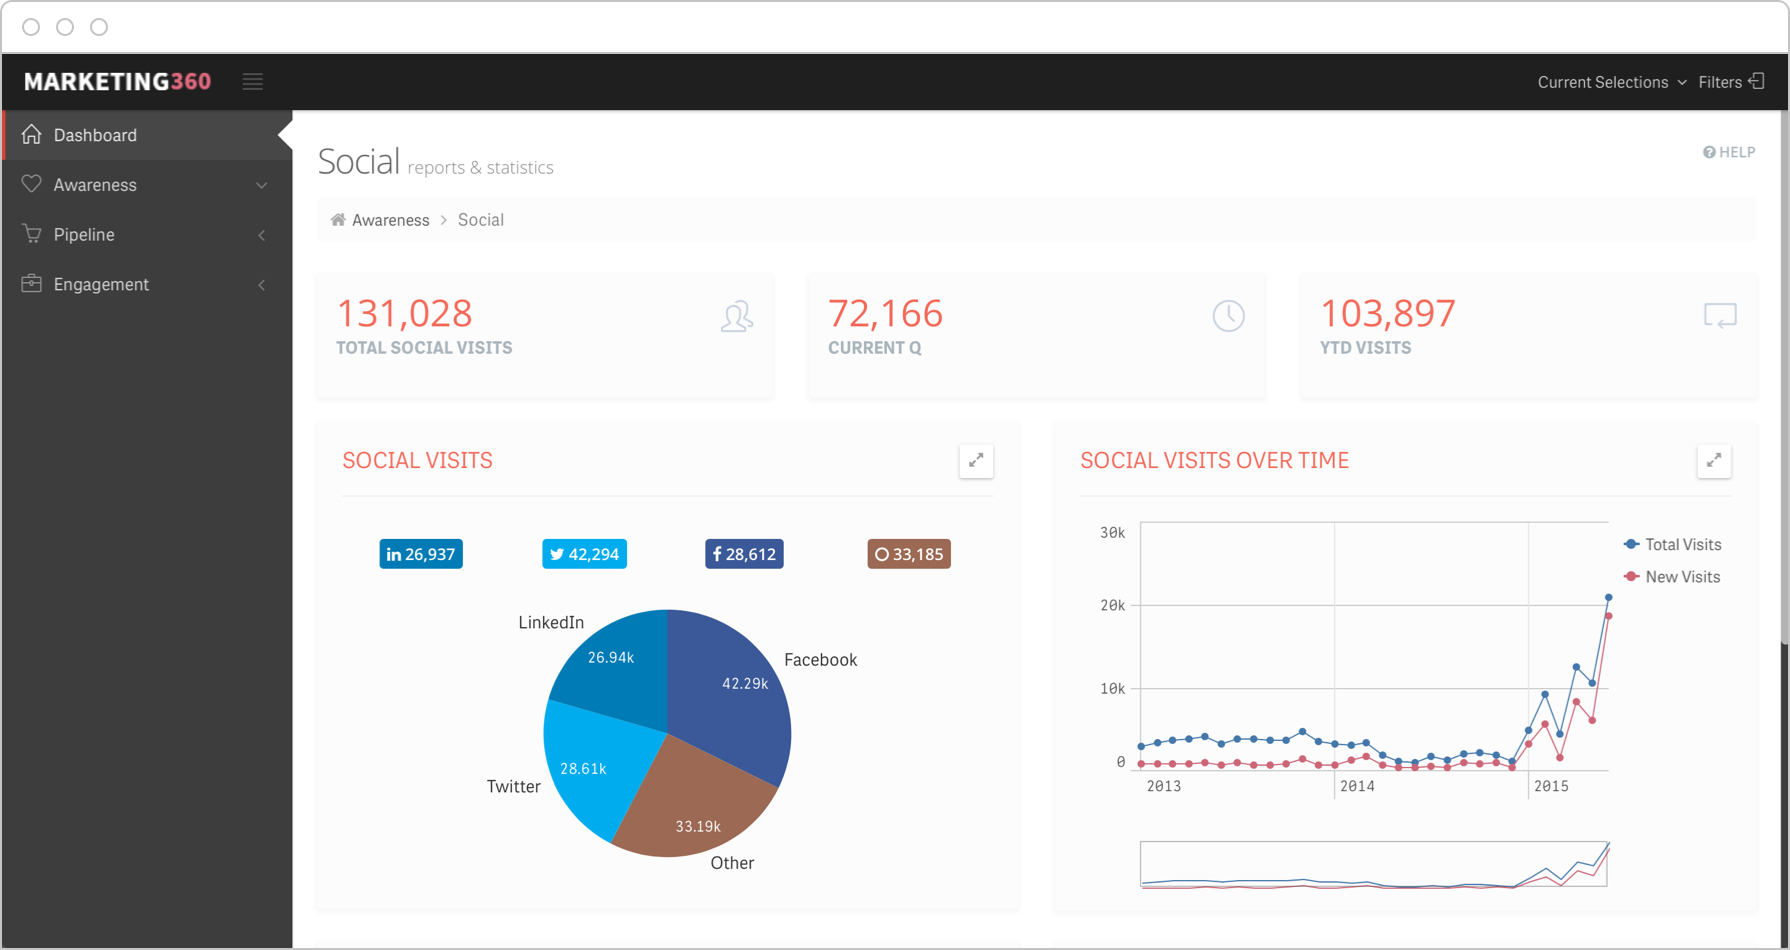
Social media managers should have KPIs that represent reach, engagement, and conversion to revenue. The 15 social media key performance indicators examples below should be applied both as totals and for each social media platform that your organization is active on.
-
- Social Share of Voice (SSoV)
- Total Reach
- Total Impressions
- Followers or Fans or Subscribers
- Audience Growth Rate
-
- Share Rate (Shares or ReTweets)
- Interest Rate (Likes, Reactions, Favorites)
- Response Rate (Comments, Replies)
- Key Post or Hashtag Reach
- Link Clicks
-
- Site Traffic From Social (By Platform)
- Conversions From Social
- Conversion Rate From Social
- Revenue From Social
- Social Program ROI
How to Define the Right KPIs
- Who, what, how. Be clear about who the audience is, what they want, and how they’re going to use the KPIs. This means working with your stakeholders to identify the core KPIs that map directly to their goals and strategy.
- Be SMART. This popular acronym stands for Specific, Measurable, Attainable, Realistic, and Time-bound. This is a useful touchstone whenever you’re considering whether a metric should be a key performance indicator. SMART KPI examples are KPIs such as “revenue per region per month” or “new customers per quarter”.
- Iterate and evolve. Over time, see how you or your audience are using the set of KPIs and if you find that certain ones aren’t relevant, remove or replace them.

