Data Discovery
What it is, why it matters, and best practices. This guide provides definitions and practical advice to help you understand and practice modern data discovery.
Data Discovery Guide
What is Data Discovery?
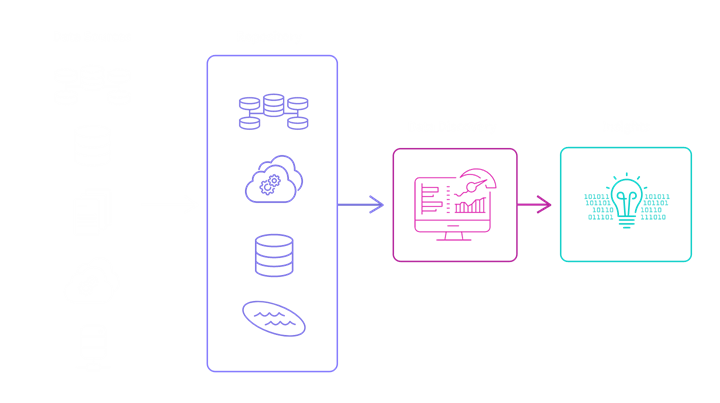
Data discovery refers to the process of exploring and analyzing data to uncover patterns, identify relationships, and gain insights that improve decision making and business performance. It involves combining and transforming data from various sources, examining data structures, and applying visualization techniques to understand and extract valuable information.
Why It Matters
Your organization likely accumulates vast quantities of data from various sources such as customer interactions, supply chains, financial systems, and production operations. And if you’re like many decision makers today, you find yourself overwhelmed by a deluge of data while craving valuable insights.
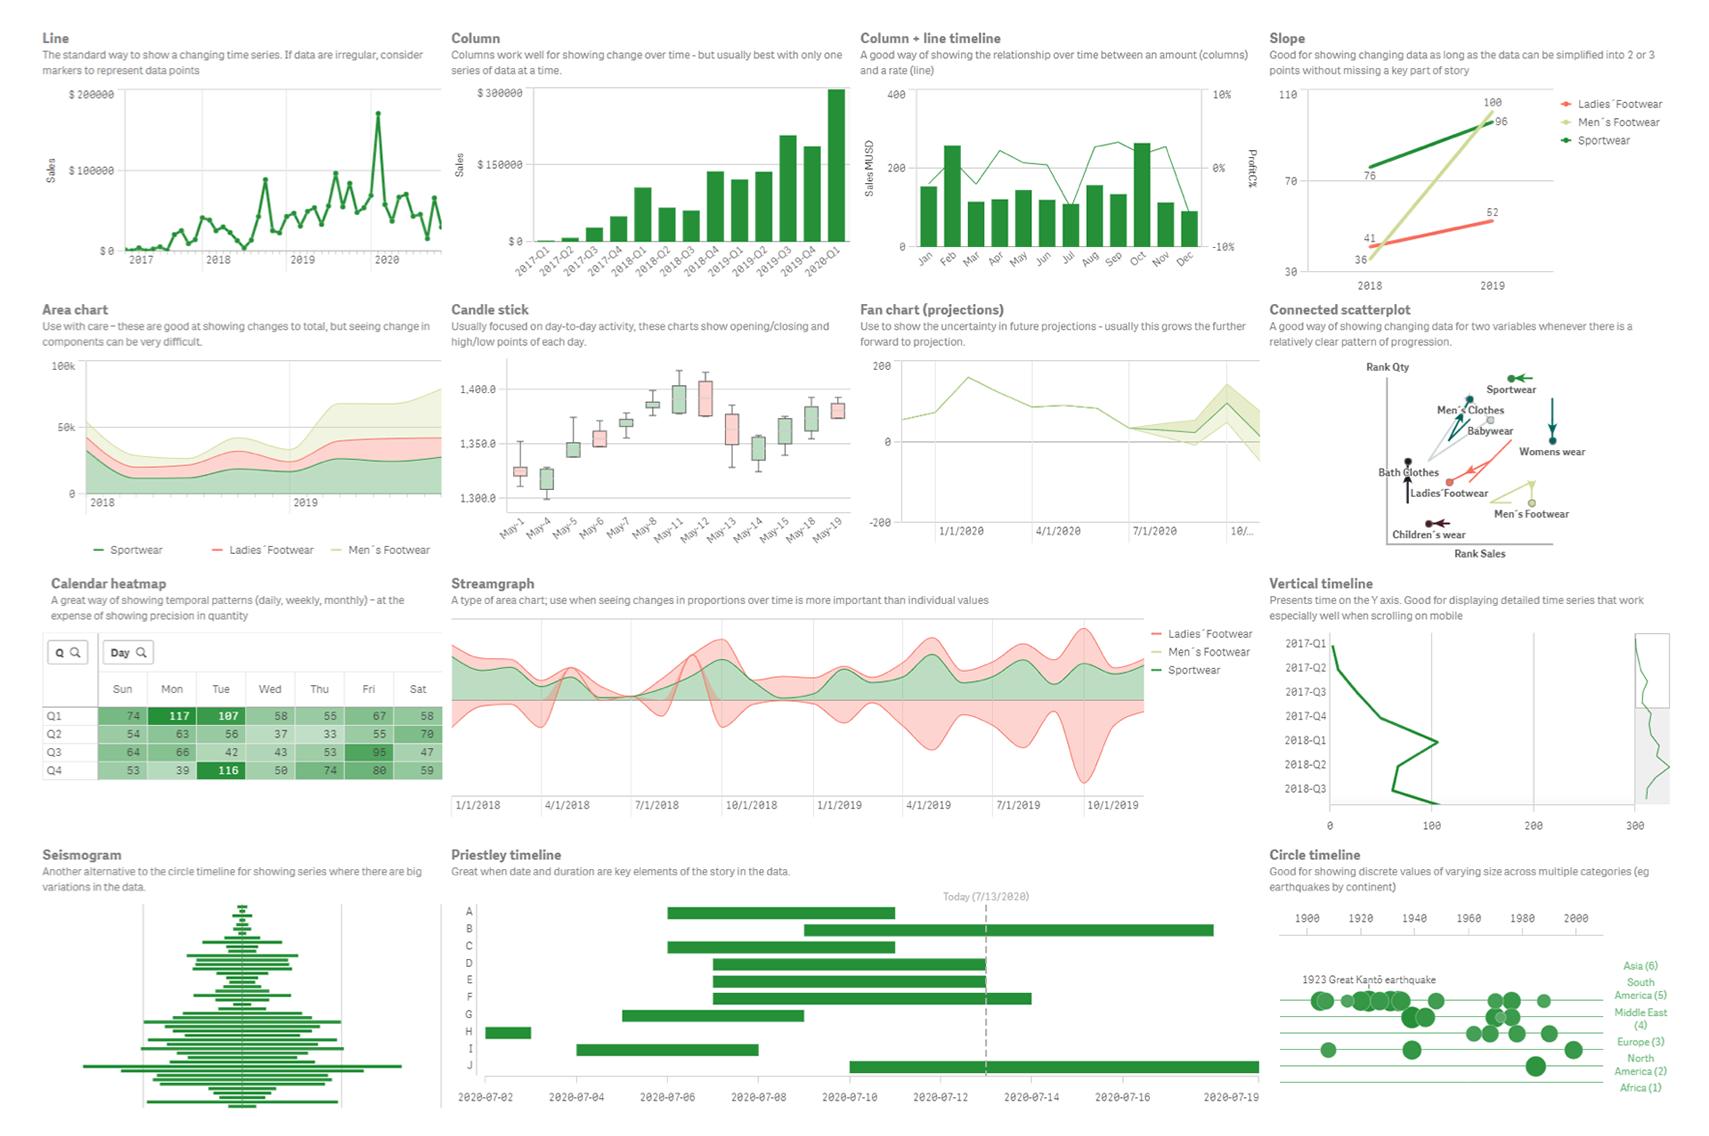
Overall, data discovery empowers you to systematically explore your data, gain valuable insights, and make data-driven decisions that drive innovation, improve operational efficiency, and achieve strategic objectives. One key aspect of data discovery is having a visual representation of your data in graphs, charts, and maps. This helps you recognize patterns in data that may not be identified by analytics tools.
The best data discovery software provides a user-friendly interface and AI-assists which make it easy for any user in your organization to do this in a governed way, improving data literacy and encouraging self-service analytics.
Let’s dig a bit deeper into 6 key benefits:
Data Validation: Data discovery helps you validate the accuracy, completeness, and reliability of your data. By examining the data from different angles and cross-referencing it with other sources, data inconsistencies or discrepancies can be detected and corrected, ensuring data integrity and quality.
Uncovering Opportunities: It can reveal hidden opportunities and untapped potential. By exploring the data, you can discover new market trends, customer preferences, or emerging patterns that can be leveraged to develop innovative products, improve customer experiences, or identify new business opportunities.
Insights and Decision Making: It enables you to gain valuable insights from your data, allowing you to make informed decisions. Patterns and trends can be identified, leading to better strategic planning, improved operational efficiency, and enhanced business performance.
Compliance and Risk Management: Examining patterns or anomalies in the data allows you to uncover potential compliance issues, such as data breaches or regulatory violations. It also aids in identifying and mitigating risks, enabling proactive measures to address potential threats.
Data-driven Culture: It promotes a data-driven culture within your organization. It encourages curiosity, exploration, and evidence-based decision-making, empowering your employees to explore data and derive insights independently. This fosters innovation, collaboration, and a more proactive approach to problem-solving.
10 Ways to Take Your Visualizations to the Next Level
How It Works
The data discovery process may vary depending on your specific project, but typically it involves the 8 key steps described below.
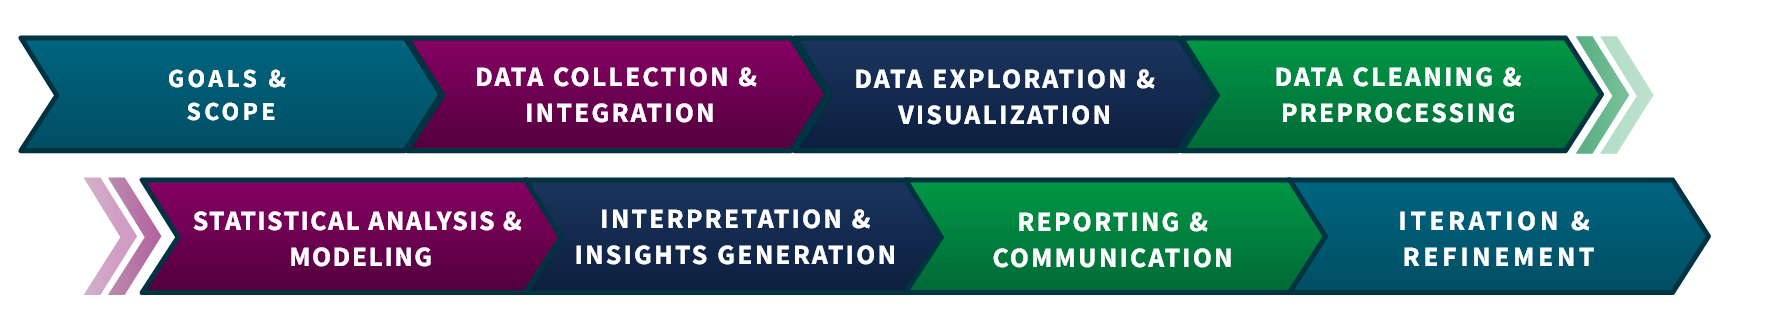
Goals & Scope: Clearly articulate your goals for the data discovery process and establish the scope of analysis, including specific data sources, timeframes, and desired outcomes. This step ensures that the exploration is focused and aligned with your organization's objectives.
Data Collection & Integration: Gather relevant data from various sources, such as databases, files, APIs, or external platforms, ensuring data integrity and quality. Integrate and consolidate the data into a unified view, taking into account data formats, structures, and potential data transformations.
Data Exploration & Visualization: Explore the data by applying visualizations, statistical techniques, and exploratory analysis to uncover patterns, trends, anomalies, and relationships within the dataset. Utilize interactive tools and visual representations to gain insights and facilitate data exploration.
Data Cleaning & Preprocessing: Cleanse the data by identifying and addressing errors, missing values, duplicates, outliers, and inconsistencies. Perform data transformations, normalization, and standardization to ensure data quality and remove any biases or noise that might affect the analysis.
Statistical Analysis & Modeling: Apply statistical methods, algorithms, or machine learning techniques to extract meaningful insights from the data. This step involves identifying correlations, performing predictive modeling, clustering, classification, or other analytical approaches to uncover valuable patterns and relationships. Historically, you’d need a data scientist to build, refine, and deploy models. However, if your model is not too complex, AutoML tools allow data analysts to now perform these tasks.
Interpretation & Insights Generation: Interpret the results of your analysis, linking the findings back to your initial goals. Generate actionable insights, identifying key takeaways, trends, anomalies, or opportunities that can drive decision making, improve processes, or provide strategic guidance.
Reporting & Communication: Present your findings in a clear, concise, and visually appealing manner to communicate the discovered insights effectively. Use visualizations, dashboards, reports, or presentations to convey the results to stakeholders, enabling them to understand and act upon the insights derived from the data.
Iteration & Refinement: Continuously refine your analysis and exploration process based on feedback, new questions, or evolving business needs. Iterate through the steps, incorporating additional data sources, refining models, or exploring different angles to deepen the understanding and uncover further insights.
AI & Data Discovery
Artificial intelligence is playing a pivotal role in supporting data discovery by enhancing the efficiency, effectiveness, and depth of analysis. Overall, Machine learning and AI automates data processing tasks, facilitates intelligent exploration, enables advanced analytics and modeling, supports natural language interactions, provides recommendations, automates insights generation, and augments data.
How AI supports data discovery:
Automated Data Processing: AI-powered algorithms and tools can automate data processing tasks such as data cleansing, data integration, and data transformation. This automation reduces manual effort, accelerates the data preparation phase, and ensures data quality, allowing data analysts and scientists to focus more on exploration and analysis.
Intelligent Data Exploration: AI techniques, including machine learning and natural language processing, enable intelligent data exploration. AI algorithms can automatically uncover hidden patterns, correlations, and anomalies within large datasets, enabling analysts to discover insights that may have been overlooked. AI-powered visualization tools assist in presenting complex data relationships in a more intuitive and understandable manner.
Augmented Analytics and Predictive Modeling: AI enables advanced analytics and predictive modeling capabilities, allowing you to gain deeper insights from your data. Machine learning and AutoML algorithms can analyze vast amounts of data to identify trends, make predictions, and generate accurate forecasts. This helps you anticipate future outcomes and make proactive decisions based on data-driven insights.
Natural Language Processing (NLP): NLP techniques enable AI systems to understand and interpret human language. AI-powered chatbots or virtual assistants can assist you in retrieving relevant information, answering queries, and performing ad-hoc analysis through conversational interfaces. NLP also supports text mining and sentiment analysis, enabling you to extract valuable insights from unstructured text data.
Recommendation Engines: AI-based recommendation engines leverage machine learning algorithms to provide personalized recommendations and suggestions based on historical data. In the context of data discovery, recommendation engines can suggest relevant datasets, visualization techniques, or analysis approaches, facilitating the exploration and discovery process.
Automated Insights Generation: AI systems can automatically generate insights and summaries from large datasets, reducing the manual effort required for analysis. By leveraging techniques such as automated anomaly detection, pattern recognition, and trend analysis, AI can highlight key findings, outliers, or significant changes within the data, enabling analysts to focus on the most critical aspects of the discovery process.
Data Augmentation and Synthesis: AI techniques, such as generative adversarial networks (GANs), can generate synthetic data that resembles real-world datasets. This synthetic data can be used to augment existing datasets, expand the scope of analysis, or simulate scenarios that are difficult or costly to obtain in real life. AI-generated synthetic data enables you to perform more comprehensive and diverse analyses.
Use Cases
A broad range of job roles and industries employ data discovery. Here are representative examples for different industries:
-

Insurance: An insurance company identifies patterns in customer claims data to detect fraudulent activities and improve risk assessment.
-

Financial services: Financial institutions analyze customer transaction data and identify patterns of fraudulent transactions, supporting fraud detection and prevention efforts.
-

Retail: By exploring customer purchasing data, retail businesses uncover insights into customer preferences, buying patterns, and market trends, informing inventory management and personalized marketing strategies.
-

Healthcare: A healthcare facility analyzes patient records, medical histories, and treatment outcomes to identify patterns that can improve diagnosis accuracy, treatment effectiveness, and patient care.
-

Energy: Energy companies analyze sensor data, weather patterns, and energy consumption trends to optimize energy production, improve operational efficiency, and identify potential areas for cost savings.
-

Life Sciences: A life sciences company analyzes genomic data, clinical trial results, and drug interactions to accelerate drug discovery, personalized medicine, and advancements in healthcare research.
-

Manufacturing: By exploring production data, supply chain information, and equipment sensor data, manufacturers gain insights into process efficiencies, quality control, and predictive maintenance, enabling optimization of operations and cost reduction.
-

Public Sector: A government organization analyzes data sources to identify patterns, trends, and correlations that inform policy decisions, resource allocation, and public service improvements.
Data Discovery Tools
Here are the key capabilities of data discovery tools:
Data Exploration: These tools allow users to interactively explore and navigate through large datasets, examining the data from different perspectives and dimensions to uncover insights.
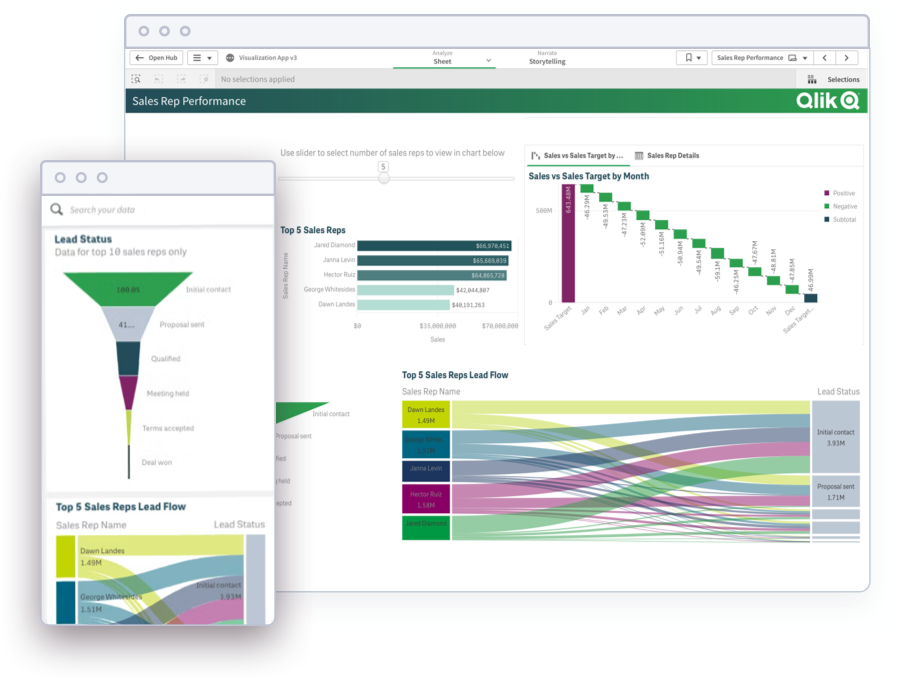
Data Visualization: The tools provide visual representations such as charts, graphs, and dashboards to present data in a visually intuitive and informative manner, facilitating the understanding of complex patterns and trends.
Data Aggregation and Integration: The best tools enable the integration of diverse data sources, consolidating data from multiple systems or formats into a unified view for comprehensive analysis.
Data Quality: These tools automatically assess and analyze the quality, completeness, and consistency of data, highlighting potential issues or anomalies that may impact analysis and decision-making.
Data Cleansing and Transformation: Top tools support data cleansing and transformation operations, allowing users to clean, standardize, and transform data to ensure accuracy and consistency for meaningful analysis.
Data Governance and Security: Data discovery platforms incorporate features for data governance, access control, and data security measures to ensure compliance with privacy regulations and protect sensitive data during exploration and analysis.
Augmented Analytics: These tools offer advanced analytical capabilities, including statistical analysis, predictive modeling, clustering, and classification algorithms, to uncover patterns, correlations, and make data-driven predictions.
Self-Service Analytics: Data discovery software empowers users with self-service capabilities, allowing non-technical users to perform data exploration and analysis independently, reducing dependence on data experts and accelerating decision-making.
Collaboration and Sharing: These tools facilitate collaboration and sharing of insights by enabling users to annotate, comment, and share visualizations, reports, or dashboards with colleagues, promoting knowledge exchange and collective decision-making.
Modern Analytics Demo Videos
See how to explore information and quickly gain insights.
- Combine data from all your sources
- Dig into KPI visualizations and dashboards
- Get AI-generated insights