Marketing KPIs
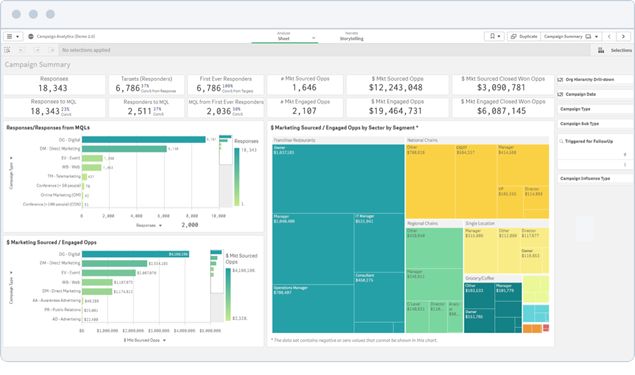
The top-10 marketing KPIs you should be tracking. This guide provides marketing KPI examples, templates and practical advice to help you define the right key performance indicators for your organization and team.
What are Marketing KPIs?
Marketing KPIs (key performance indicators) are quantifiable measures of performance for specific strategic objectives. Marketing leaders and teams use KPIs to gauge the effectiveness of their efforts, guide their strategy, and optimize their programs and campaigns. Examples of key performance indicators include, “marketing qualified leads” or “customer acquisition cost”.
What are Marketing Metrics?
Marketing metrics track the performance of everyday marketing activities which support KPIs. While metrics impact overall marketing success, they’re not the most critical measures. Some examples include “email open rate” or “keyword ranking”.
More resources:
- Get the KPI Dashboards Guide
- Design your own Marketing Dashboard

Don’t just measure. Measure what matters.
Download the KPI Planning Guide to learn:
- 10 steps to strong KPIs
- Which questions help you define your KPIs
- 170 KPI examples and templates
Top-10 Marketing KPIs
Marketing and RevOps leaders track KPIs to judge the effectiveness of their efforts, guide their strategy, and optimize their programs and campaigns. The marketing KPI examples below cover all phases of the customer funnel.
Additional considerations include KPIs around customer retention (such as churn rate and repeat purchases), PR (such as reach and active coverage), and branding (such as sentiment and unaided awareness).
Revenue Attributed to Marketing
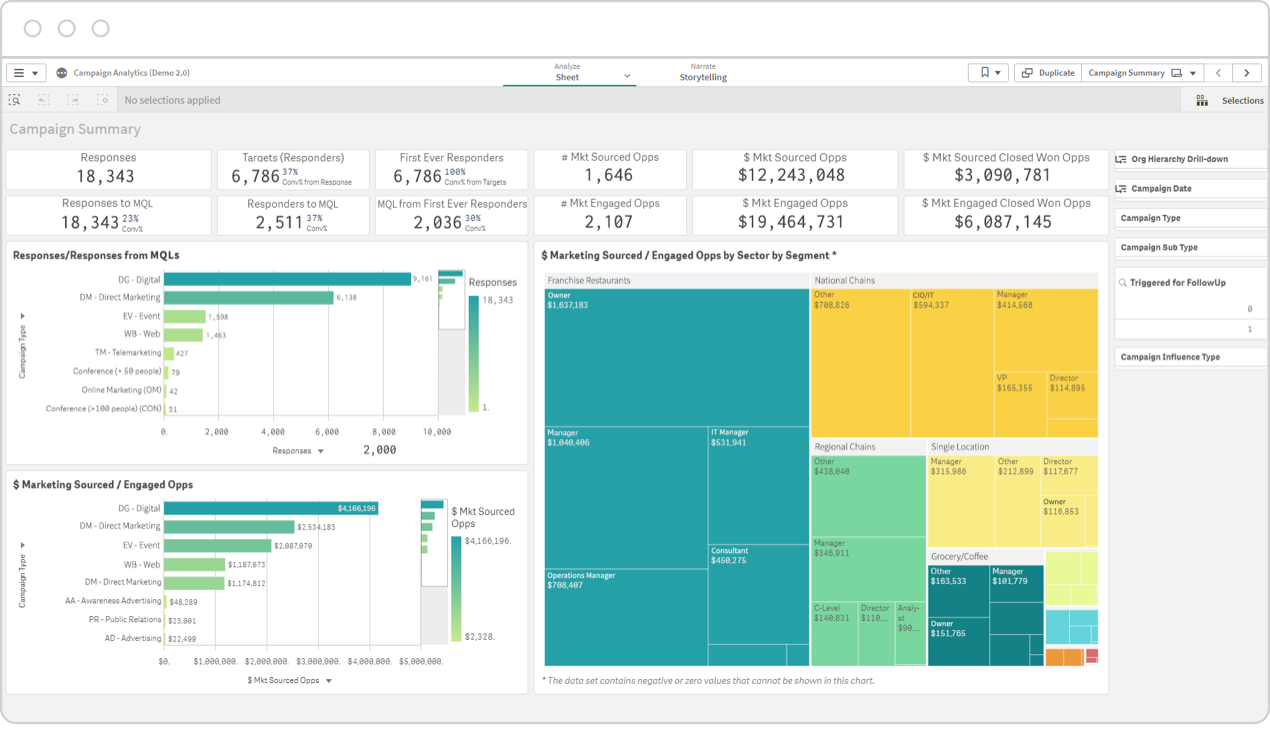
This key performance indicator measures marketing’s overall impact on top-line revenue. To accurately calculate this KPI, you’ll need modern marketing analytics which can combine your campaign data with data from your company’s CRM system. This allows you to optimize your efforts based on MQLs, SQLs, closed orders and revenue.
-
Marketing Qualified Leads (MQLs)
Marketing Qualified Leads (MQLs) are leads which marketing has identified as being more likely to become a customer than other leads. This identification is based on actions and behavior which indicate interest in buying the products or services you offer, such as trying a demo of your software or downloading an ebook.
-
Sales Qualified Leads (SQLs)
Sales Qualified Leads (SQLs) are leads which the sales team has screened and identified as being highly interested in buying the products or services you offer. This identification is based on actions such as requesting a quote, purchase information or a live demo and/or profile information such as the lead's industry, company size and job role.
-
Organic Traffic & Leads
Organic traffic refers to the visitors who come to your website from organic search results. Organic leads represents the number of leads attributed to your organic traffic. Tracking organic visitors and leads helps you understand your SEO efforts and overall awareness.
-
Lifetime Value of a Customer (LTV)
Lifetime Value of a Customer (LTV) refers to the projected average revenue a customer will generate over the lifetime of their relationship with your business. This key performance indicator can be compared to the Customer Acquisition Cost (CAC) on a holistic or campaign level to help you determine the long-term success of your efforts.
Funnel Conversion Rates
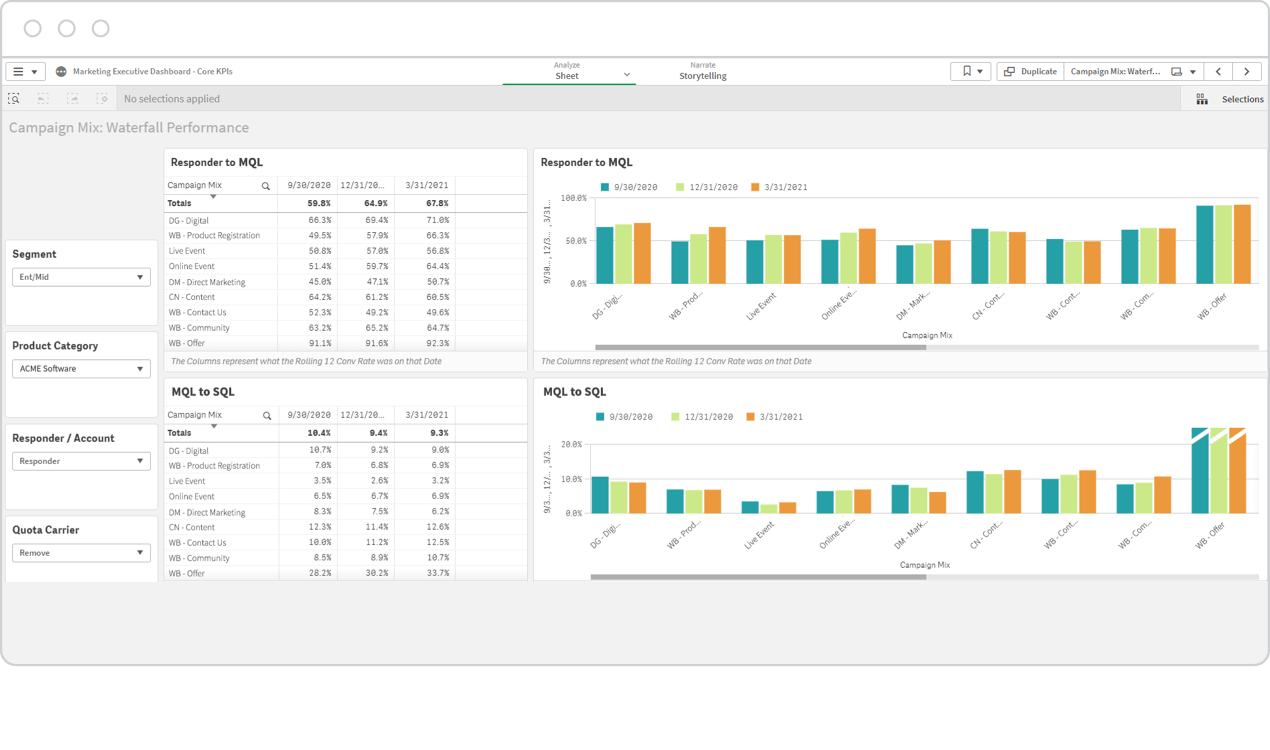
With conversion rates, the first thing that comes to mind for many people are metrics, not marketing KPIs. They think of conversions on a landing page or email. KPIs represent the strategic level, so you should focus on conversion rates between each main stage of your funnel (also known as the buyer’s journey).
| Formula: |
|
| Example: |
|
Each organization will have its own unique buyer’s journey, so you’ll define your own stages. Typical marketing KPI examples for a B2B company might be:
- Site Visit to Lead Ratio
- Lead to Marketing Qualified Lead (MQL) Ratio
- MQL to SQL Ratio
- SQL to Quote Ratio
- Quoted to Closed Customer Ratio
How to Design Best-in-Class Dashboards
Download our ebook with 4 must-see dashboard examples.
Customer Acquisition Cost (CAC)
Customer acquisition cost (CAC) refers to the expense incurred to convince a person or organization to buy the products or services you offer. The formula for calculating CAC is simple but it can be difficult to accurately derive the data you need.
| Formula: |
|
| Example: |
|
When calculating your total marketing expense, be sure to include all ‘fixed’ costs such as salaries for your team and ‘variable’ costs such as advertising and contractors.
It can be difficult to accurately calculate CAC per marketing channel (online, retail, direct mail, etc) or marketing program (PPC, social media, email, etc). This is because there is often a spill-over effect between channels and programs. For example, a prospect might see an outdoor billboard before they see your paid search ad.
But, if you focus only on digital marketing KPIs and use a modern marketing analytics tool, you can connect new customers back to their “last touch” attribution source and use only those customers in your calculation. For example, you can map your paid search expense to all new customers who most recently came to you from paid search. However this still won’t be a perfect measure since these customers may have interacted with you in other ways, such as email and organic search.
Cost Per Lead (CPL)
Cost per lead is another common marketing KPI and is closely-related to CAC.
| Formula: |
|
| Example: |
|
Social Media Engagement
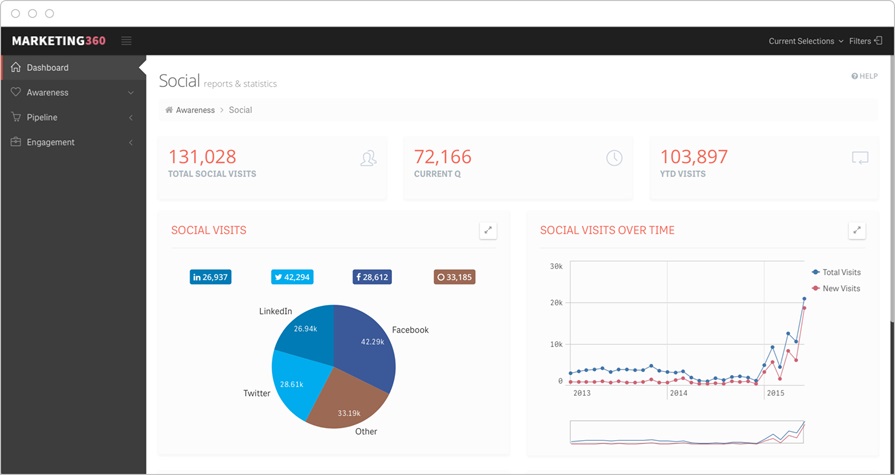
Social media has become such an important marketing activity for most organizations today that you should consider creating a few high-level marketing KPIs focused in this area. Depending on your business, you could choose to track marketing KPI examples such as:
- Impressions or reach
- Engagement rate
- Follower count
- Traffic to your website from social media.
At the KPI level, you should track these as aggregate figures across all platforms and possibly broken out by platform.
Net Promoter Score (NPS)
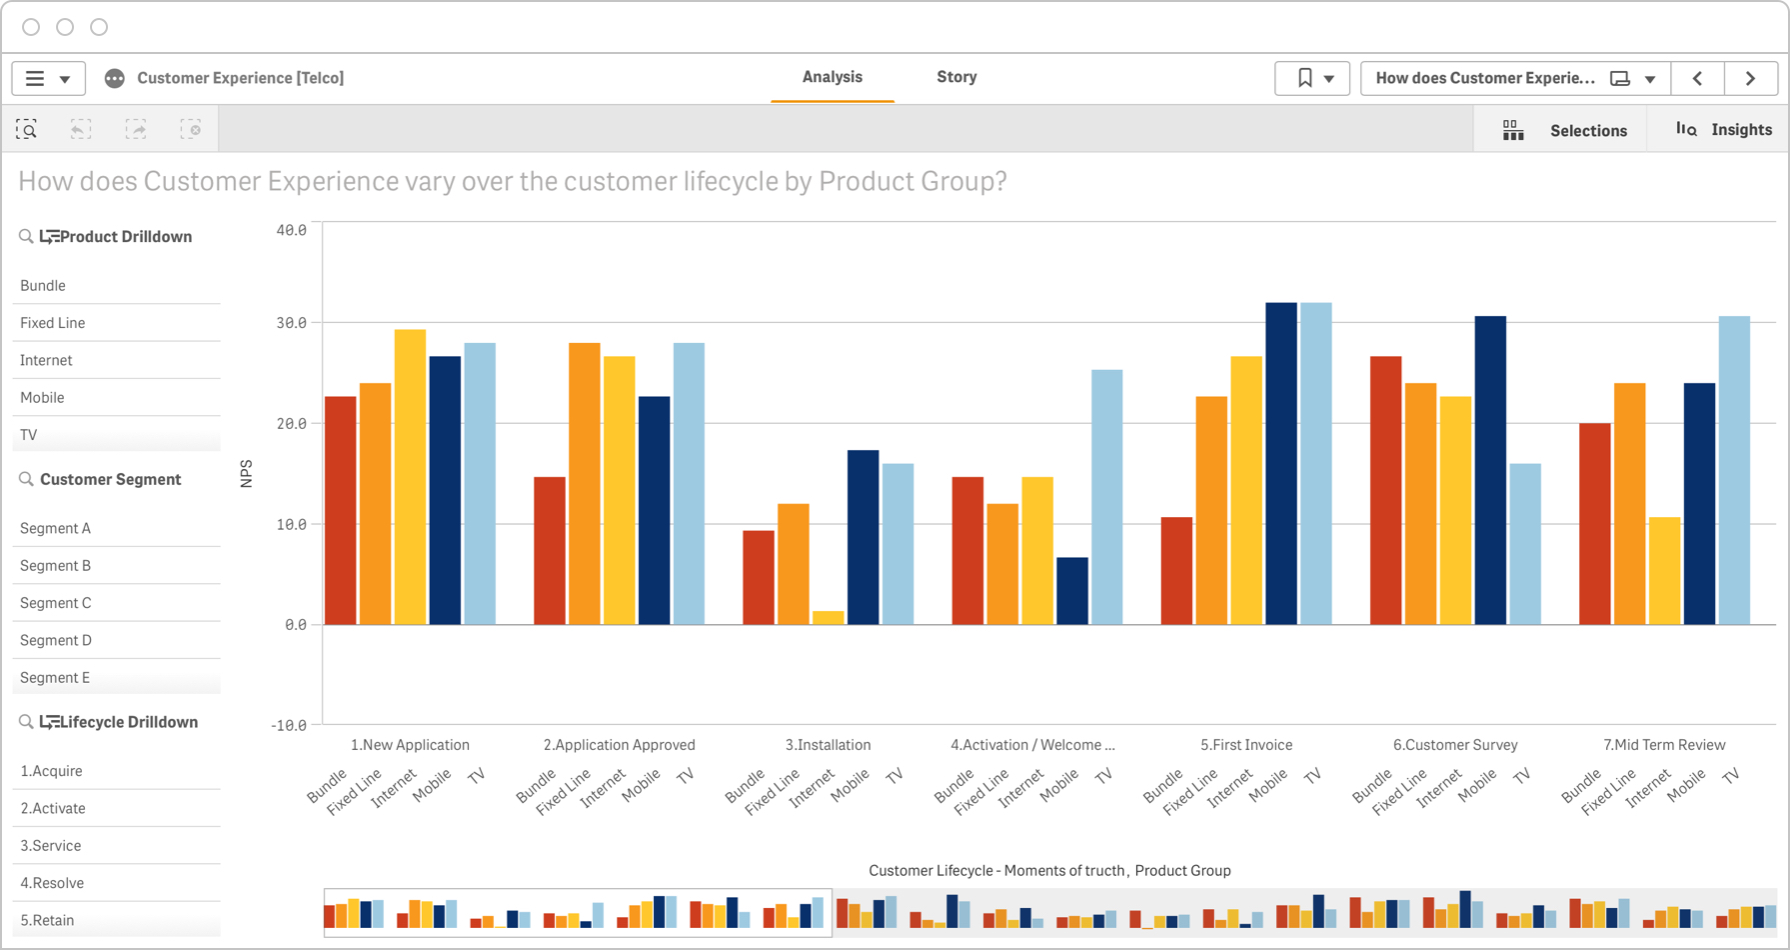
The Net Promoter Score KPI measures customer satisfaction based on how likely your customers are to recommend your company, product, or service to a friend or colleague. The above dashboard breaks out NPS scores by product group and phase of customer lifecycle.
Here’s how to derive your NPS score:
- Conduct a survey of your customers, asking them to rate on a scale of 0-10 how likely is it they’d recommend your company to others
- Label responders as follows: 0–6 = Detractor, 7–8 = Neutral, 9–10 = Promoter
- Subtract the percentage of Detractors from the percentage of Promoters
| Formula: |
Percentage of Promoters — Percentage of Detractors = NPS |
| Example: |
71% Promoters — 22% Detractors = 49 NPS |
Your company's NPS score can be a good indicator of your future growth. Naturally, any NPS score above zero means your customer base is more positive and loyal than not. The consulting firm Bain & Co, who developed the NPS index, suggests that scores above 20 are “favourable”, scores above 50 are “excellent”, and anything above 80 is “world class”.
Return on Investment (ROI)
Marketing ROI measures the profitability of your overall marketing investment. The formula compares your total expense for your marketing activities (either holistically or by program or campaign) to how much you earned in net profit.
| Formula: |
|
| Example: |
|
In this marketing KPI example, the activity earned more than double a return on its investment. As you can see, this marketing KPI can be an excellent way for your team to show the value of their efforts.
Inspire Action With Your KPIs
10 ways to take your data visualizations to the next level. Learn how to choose the right ones to highlight your KPIs and metrics.
Why are Marketing KPIs Important?
Marketing KPIs help ensure that your teams are supporting the overall goals of your organization. And, as the saying goes, you can’t improve what you don’t measure. Here are three key reasons why you need KPIs for marketing.
- Optimize programs and campaigns: KPIs and metrics shine a bright light on your successes and failures. This helps you do more of what’s working, and less of what’s not.
- Keep your teams aligned: KPIs and metrics keep the marketing team (and other teams) moving in the same direction.
- Hold your teams accountable: KPIs and metrics help employees track their progress and help managers move things along to ensure that everyone provides value.

