What is a KPI?
This guide provides examples, templates and practical advice to help you define the right key performance indicators for your organization and team.
What is a KPI?
KPI stands for key performance indicator, a quantifiable measure of performance over time for a specific objective. KPIs provide targets for teams to shoot for, milestones to gauge progress, and insights that help people across the organization make better decisions. From finance and HR to marketing and sales, key performance indicators help every area of the business move forward at the strategic level.
KPI Meaning vs Metrics Meaning
While key performance indicators and metrics are related, they’re not the same. Here’s a quick explanation:
- KPIs are the key targets you should track to make the most impact on your strategic business outcomes. KPIs support your strategy and help your teams focus on what’s important. An example of a key performance indicator is, “targeted new customers per month”.
- Metrics measure the success of everyday business activities that support your KPIs. While they impact your outcomes, they’re not the most critical measures. Some examples include “monthly store visits” or “white paper downloads”.

Don’t just measure. Measure what matters.
Download the KPI Planning Guide to learn:
- 10 steps to strong KPIs
- Which questions help you define your KPIs
- 170 KPI examples and templates
Why Are KPIs Important?
KPIs are an important way to ensure your teams are supporting the overall goals of the organization. Here are some of the biggest reasons why you need key performance indicators.
- Keep your teams aligned: Whether measuring project success or employee performance, KPIs keep teams moving in the same direction.
- Provide a health check: Key performance indicators give you a realistic look at the health of your organization, from risk factors to financial indicators.
- Make adjustments: KPIs help you clearly see your successes and failures so you can do more of what’s working, and less of what’s not.
- Hold your teams accountable: Make sure everyone provides value with key performance indicators that help employees track their progress and help managers move things along.
Types of KPIs
Key performance indicators come in many flavors. While some are used to measure monthly progress against a goal, others have a longer-term focus. The one thing all KPIs have in common is that they’re tied to strategic goals. Here’s an overview of some of the most common types of KPIs.
- Strategic: These big-picture key performance indicators monitor organizational goals. Executives typically look to one or two strategic KPIs to find out how the organization is doing at any given time. Examples include return on investment, revenue and market share.
- Operational: These KPIs typically measure performance in a shorter time frame, and are focused on organizational processes and efficiencies. Some examples include sales by region, average monthly transportation costs and cost per acquisition (CPA).
- Functional Unit: Many key performance indicators are tied to specific functions, such finance or IT. While IT might track time to resolution or average uptime, finance KPIs track gross profit margin or return on assets. These functional KPIs can also be classified as strategic or operational.
- Leading vs Lagging: Regardless of the type of key performance indicator you define, you should know the difference between leading indicators and lagging indicators. While leading KPIs can help predict outcomes, lagging KPIs track what has already happened. Organizations use a mix of both to ensure they’re tracking what’s most important.
How to Develop KPIs
With so much data, it can be tempting to measure everything—or at least things that are easiest to measure. However, you need to be sure you’re measuring only the key performance indicators that will help you reach your business goals. The strategic focus is one of the most important aspects of the KPI definition. Here are some best practices for developing the right KPIs.
- Define how KPIs will be used: Talk to people who will be using the KPI report to find out what they want to achieve and how they’ll use them. This will help you define KPIs that are relevant and valuable to business users.
- Tie them to strategic goals: If your KPIs don’t relate to what you’re trying to achieve in your business, you’re wasting time. While they may be related to a specific business function like HR or marketing, every key performance indicator should tie directly back to your overall business goals.
- Write SMART KPIs: The most effective KPIs follow the proven SMART formula. Make sure they’re Specific, Measurable, Attainable, Realistic and Time-Bound. Some examples include “Grow sales by 5% per quarter” or “Increase Net Promoter Score 25% over the next three years.”
- Keep them clear-cut: Everyone in the organization should understand your KPIs so they can act on them. This is why data literacy is so important. When people understand how to work with data, they can make decisions that will move the needle in the right direction.
- Plan to iterate: As your business and customers change, you may need to revise your key performance indicators. Perhaps certain ones are no longer relevant, or you need to adjust based on performance. Be sure you have a plan in place to evaluate and make changes to key performance indicators when necessary.
- Avoid KPI overload: Business intelligence has given organizations access to mounds of data and interactive data visualization, making it easy to measure anything and everything. Keep in mind that the key performance indicator definition refers to the most important targets. Steer clear of KPI overload by focusing on the most impactful measures.
Inspire Action With Your KPIs
10 ways to take your data visualizations to the next level. Learn how to choose the right ones to highlight your KPIs and metrics.
3 Steps to a Stronger KPI Strategy
If your key performance indicators aren’t delivering the results you expect, it’s time to adjust your strategy. Here are three things you can do to ensure that people across the organization know what your KPIs mean, and how to use them to make data-driven decisions that impact your business.
- Select KPIs that matter most: To be sure you’re measuring what matters, you should include a balance of leading and lagging indicators. Lagging indicators help you understand results over a period of time such as sales over the last 30 days. Leading indicators help you predict what might happen based on data, allowing you to make adjustments to improve outcomes.
- Create a KPI-driven culture: Key performance indicators don’t mean much if people don’t understand what they are and how to use them (including what the KPI acronym means). Increase data literacy in your organization so everyone works toward strategic targets. Educate employees, assign them relevant KPIs, and use a best-in-class BI platform to keep everyone making decisions that move your business forward.
- Iterate: Keep your key performance indicators current by revising them based on market, customer and organizational changes. Meet regularly to review them, take a close look at performance to see if adjustments need to be made, and publish any changes you make so teams are always up to date.
KPI Examples
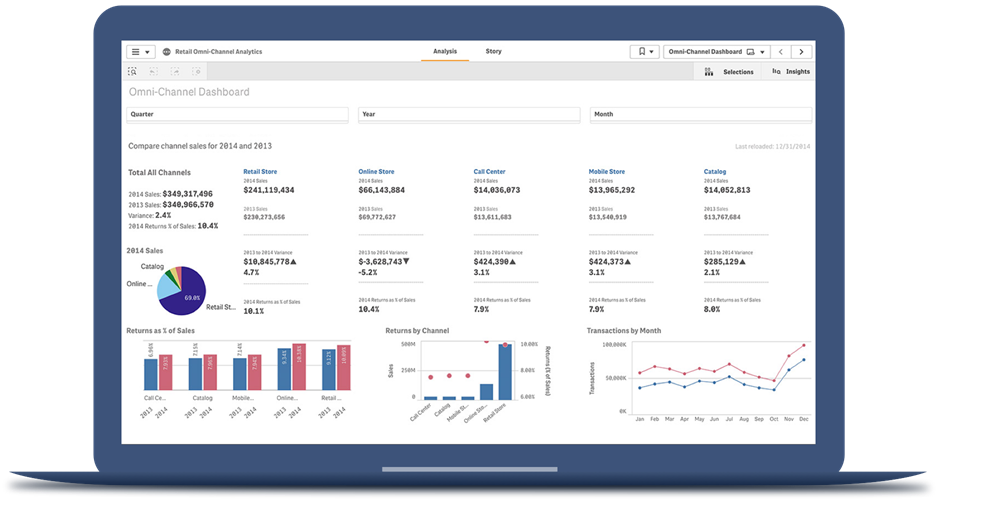
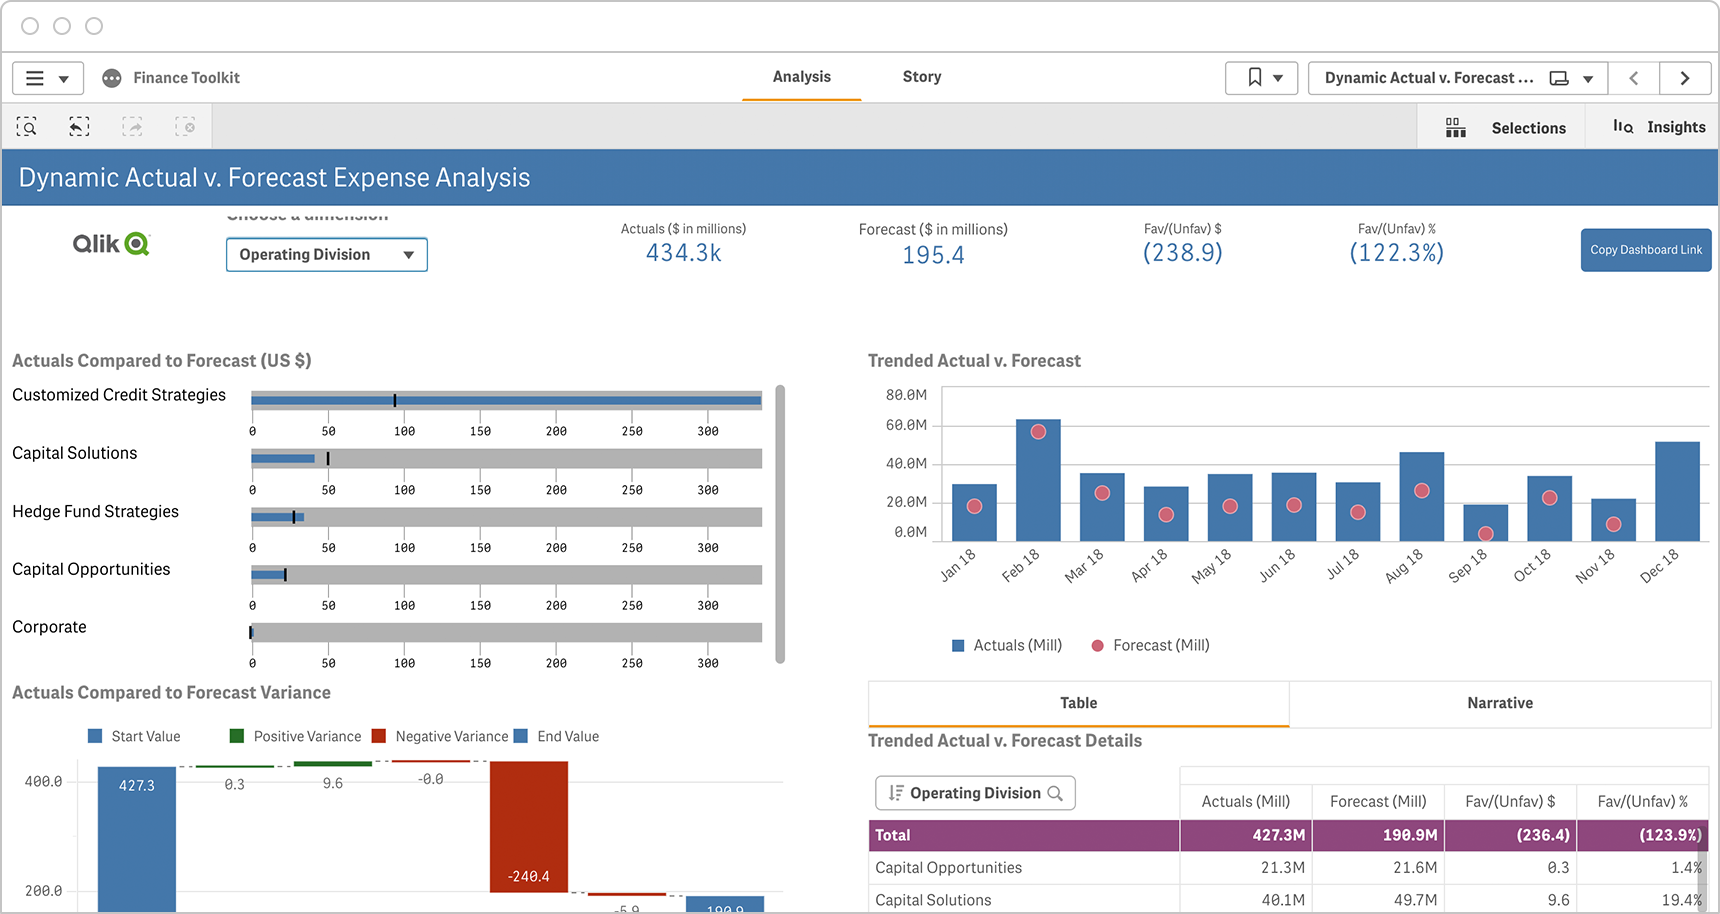
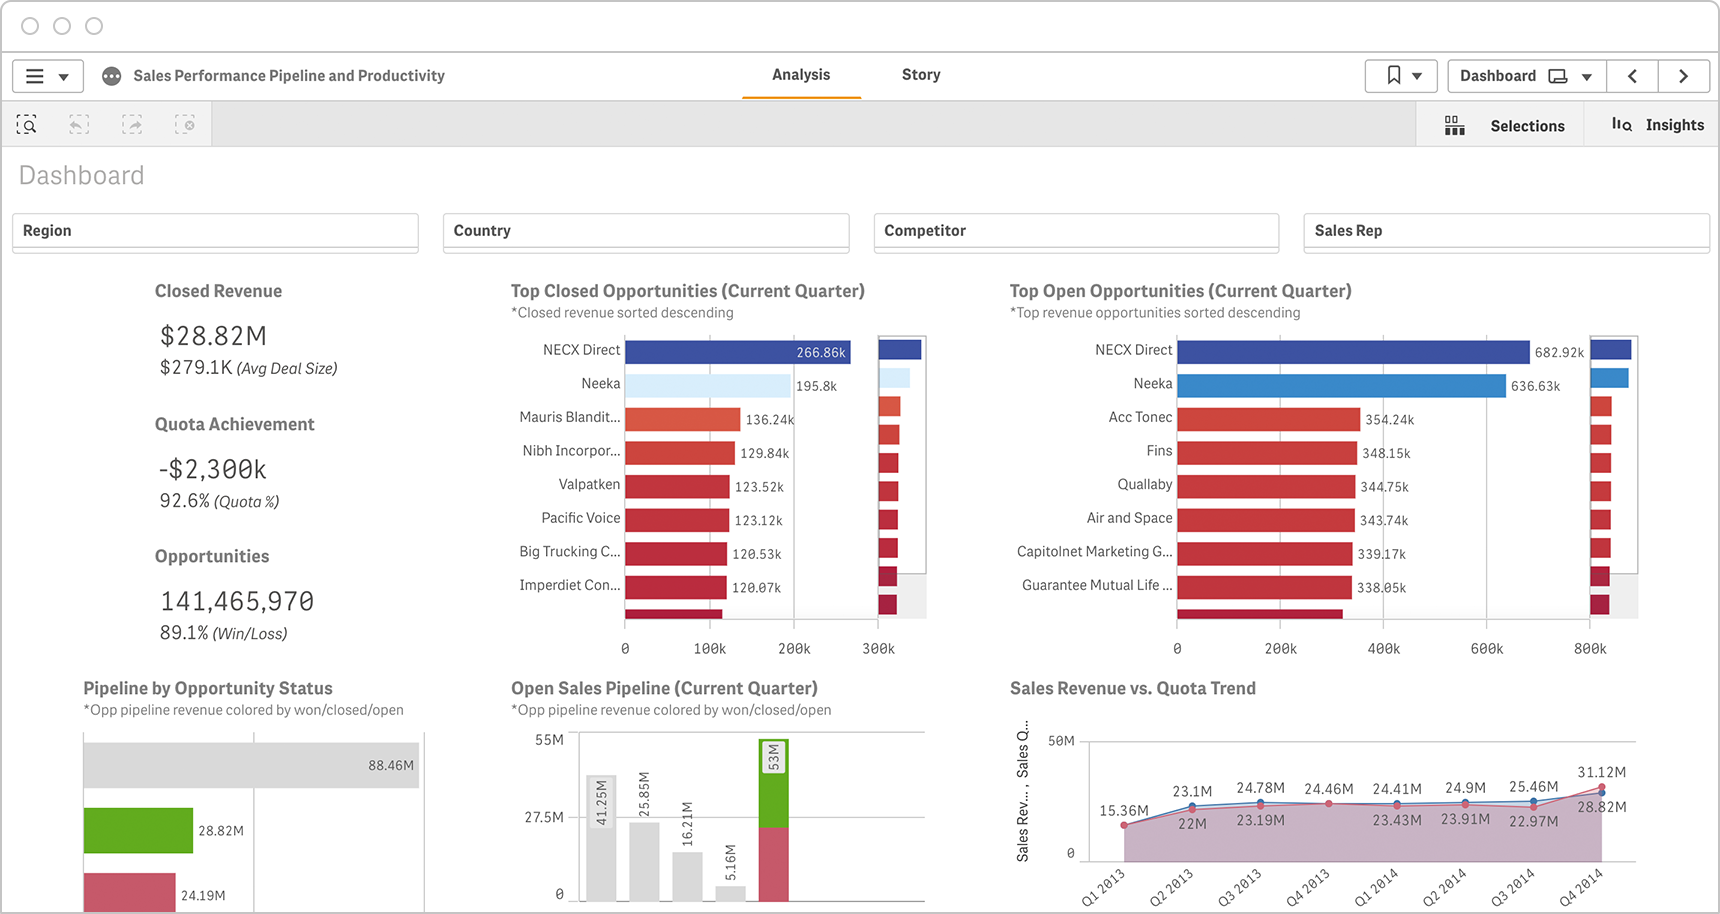
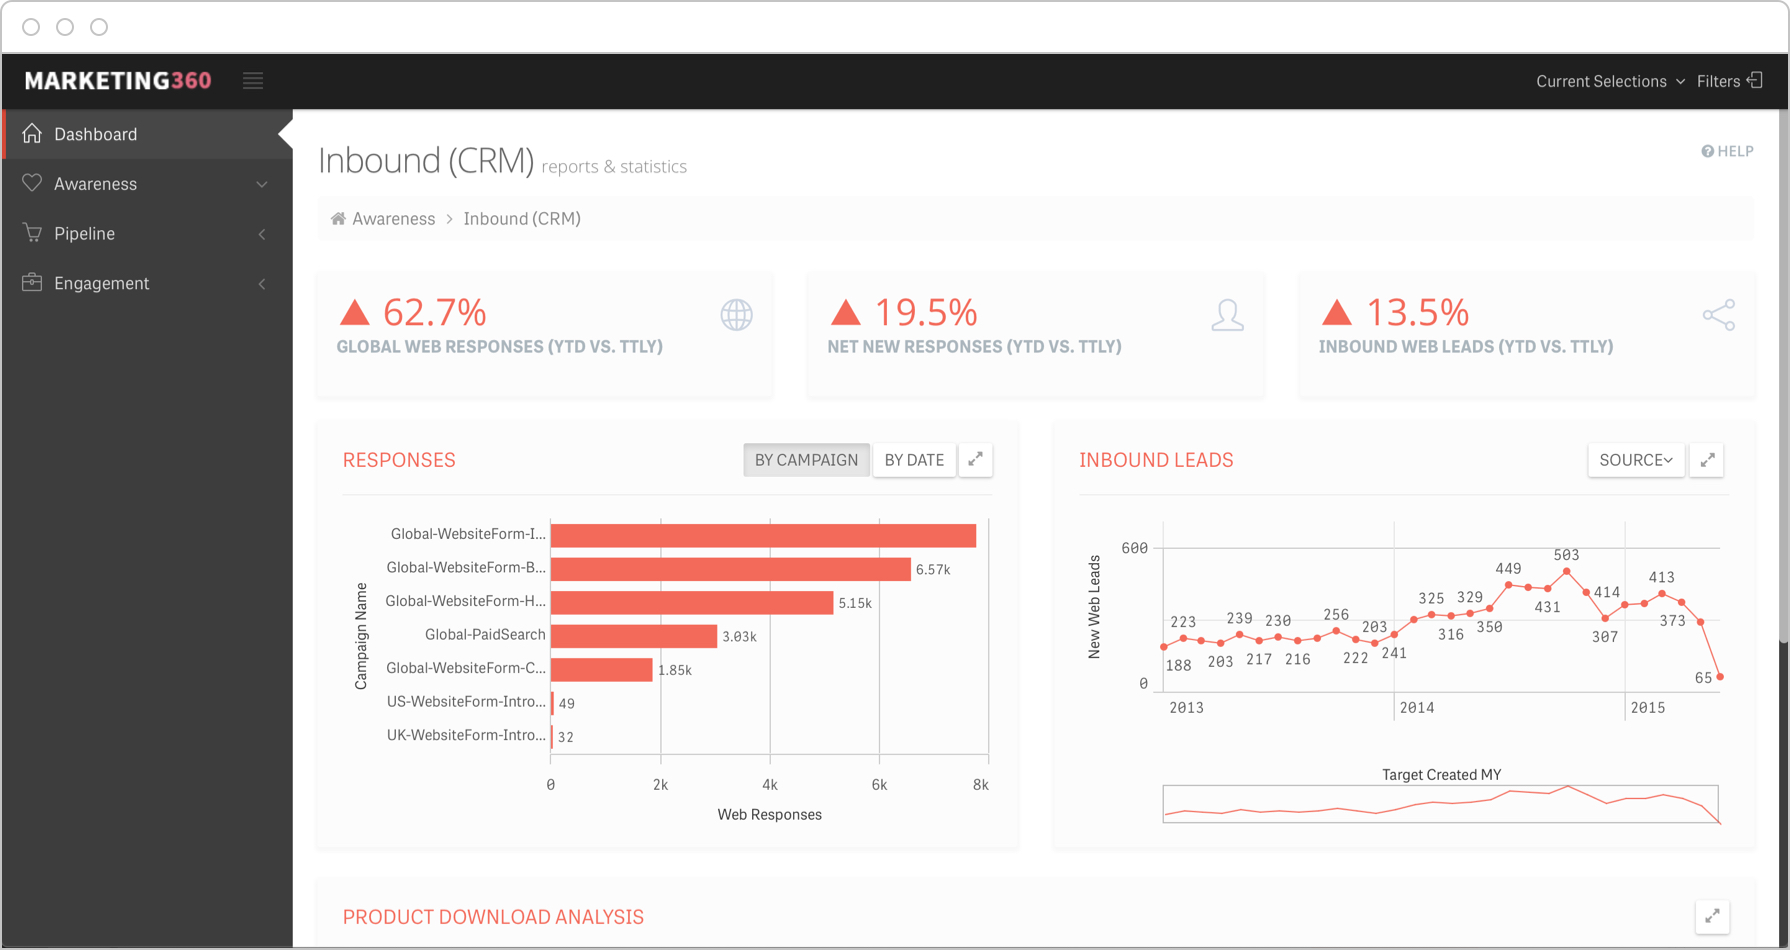
Every business unit has unique key performance indicators that help them track progress. Many organizations use KPI dashboards to help them visualize, review and analyze their performance metrics all in one place. Here are a few KPI examples by department, including a dashboard view of each.
Finance
From expense and revenue to margin and cash management, finance managers have lots of choices when it comes to tracking financial progress. Here are a few examples to consider as you define your own key performance indicators.
-
- Gross Profit Margin (and %)
- Operating Profit Margin (and %)
-
- Net Profit Margin (and %)
- Operating Expense Ratio
-
- Working Capital Ratio
Sales
Ensure your teams are meeting sales targets by tracking and regularly reviewing sales key performance indicators, including those for leads, opportunities, closed sales and volume. Here are some examples of KPIs for sales teams:
-
- New Inbound Leads
- New Qualified Opportunities
-
- Total Pipeline Value
- Sales Volume by Location
-
- Average Order Value
Marketing
Get a handle on marketing spend, conversion rates and other indicators of marketing success by clearly defining key performance indicators and aligning them with your organization’s strategic goals. Here are a few marketing KPIs to get you started.
-
- Marketing Qualified Leads (MQLs)
- Sales Qualified Leads (SQLs)
-
- Conversion Rates (For Specific Goals)
- Social Program ROI (By Platform)
-
- Return on Ad Spend (ROAS)
Learn more about Marketing KPIs
- Return on Ad Spend (ROAS)
IT Key Performance Indicators
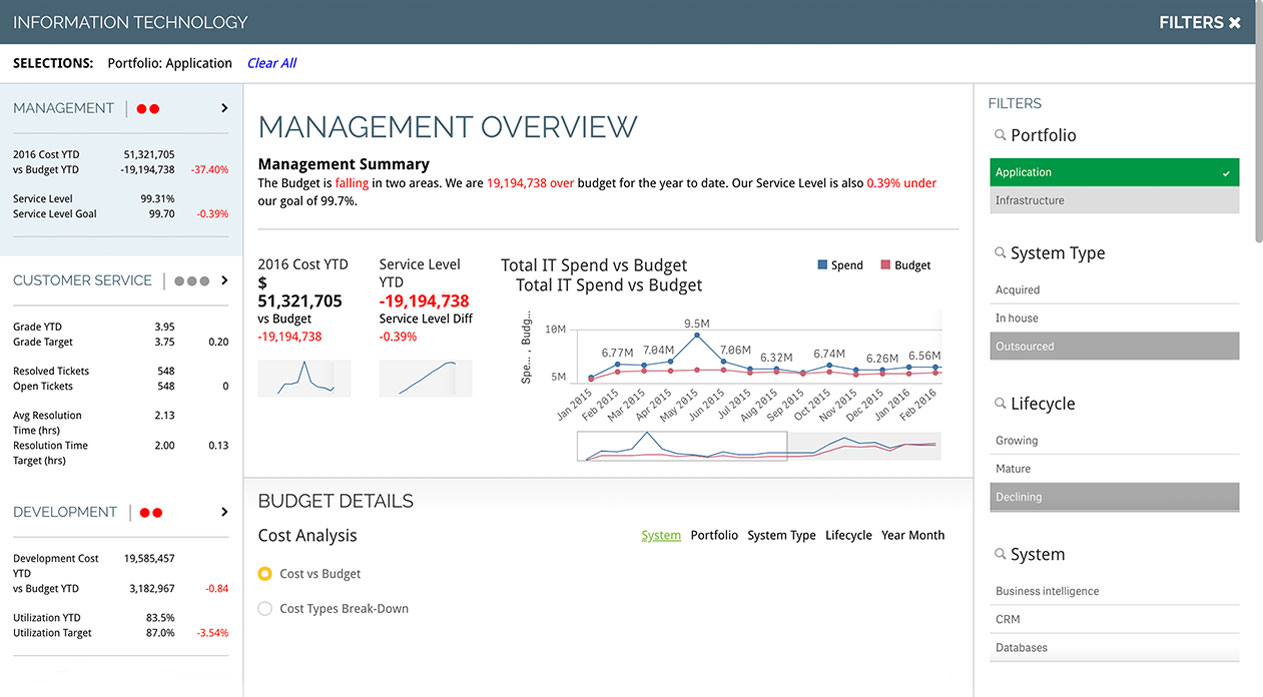
From support tickets to server downtime, IT key performance indicators can help keep teams accountable and alert them to any potential issues coming down the line. KPIs for IT teams could include targets like the following:
-
- Total Support Tickets
- Open Support Tickets
-
- Ticket Resolution Time
- Security Related Downtime
-
- IT Costs vs Revenue
- Reopened Tickets
Customer Service
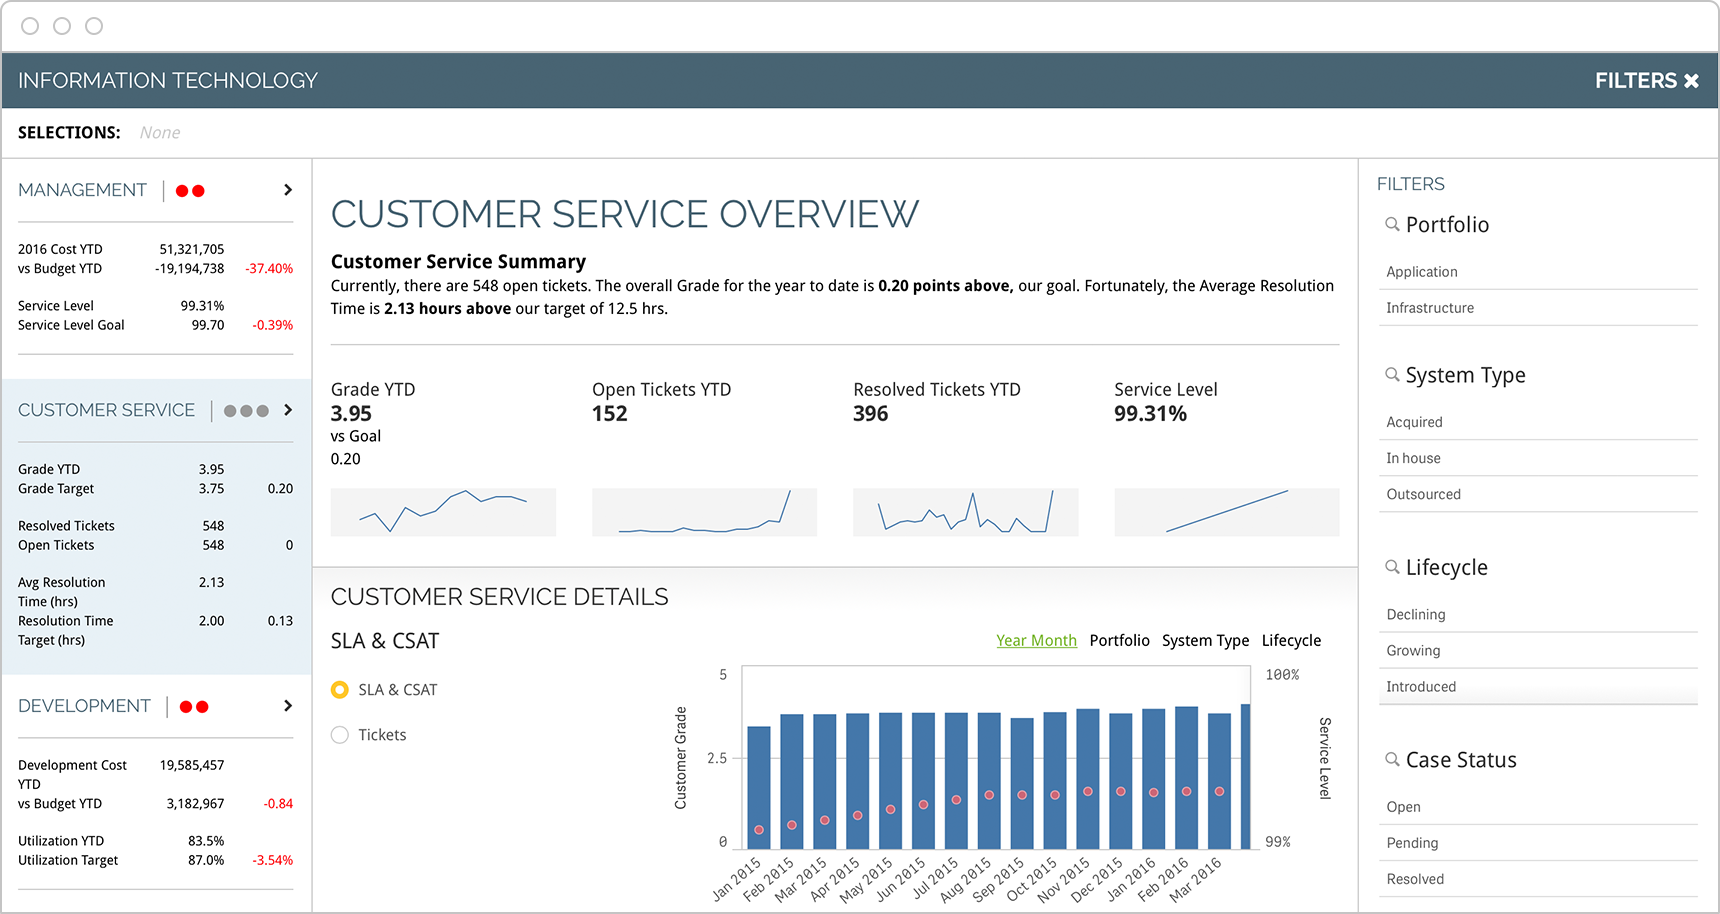
Customer service leaders should track progress related to customers, employees and finances. In addition, key performance indicators should cover both short- and long-term targets, including support response times, customer satisfaction and others that help reach service objectives.
-
- First Contact Resolution Rate
- Average Response Time
-
- Most Active Support Agents
- Cost Per Conversation
-
- Customer Effort Score
FAQs
-
KPI stands for key performance indicator.
-
Key performance indicators (KPIs) are targets that help you measure progress against your most strategic objectives. While organizations can have many types of metrics, KPIs are targets that are “key” to the success of your business.
-
Key performance indicators can be either strategic or operational, and apply to specific business units. For example, finance tracks revenue growth rate and net profit margin, sales measures net sales and sales by region, customer service tracks Net Promoter Score and average resolution time, and marketing might measure traffic-to-lead ratio and cost per lead. Operational key performance indicators could include order fulfillment time and time to market.
-
There are many factors to consider as you develop your key performance indicators (KPIs). Here are some to keep in mind: Define how they will be used, tie them to strategic goals, keep them SMART (specific, measurable, attainable and time-bound), make them understandable, adjust them as needed, and take care only to measure the most important things.
-
While every organization is different, there are a few ways to create high-performing key performance indicators: include a balance of leading and lagging indicators, create a KPI-driven culture by increasing data literacy, and regularly review and adjust your key performance indicators as your audience, market and business change.
