What is spatial analysis? How is geospatial analytics used in business?
What is spatial analysis?
Imagine opening up a treasure map for your business that shows you where new business opportunities, cost savings, and partnerships are or could be. In business terminology, this treasure map is the “geo-enablement” of the digital enterprise.
Why is spatial analysis important?
The geospatial analytics market is projected to grow from $40.65 billion in 2018 to $86.32 billion by 2023.
Key capabilities of spatial analytics technologies
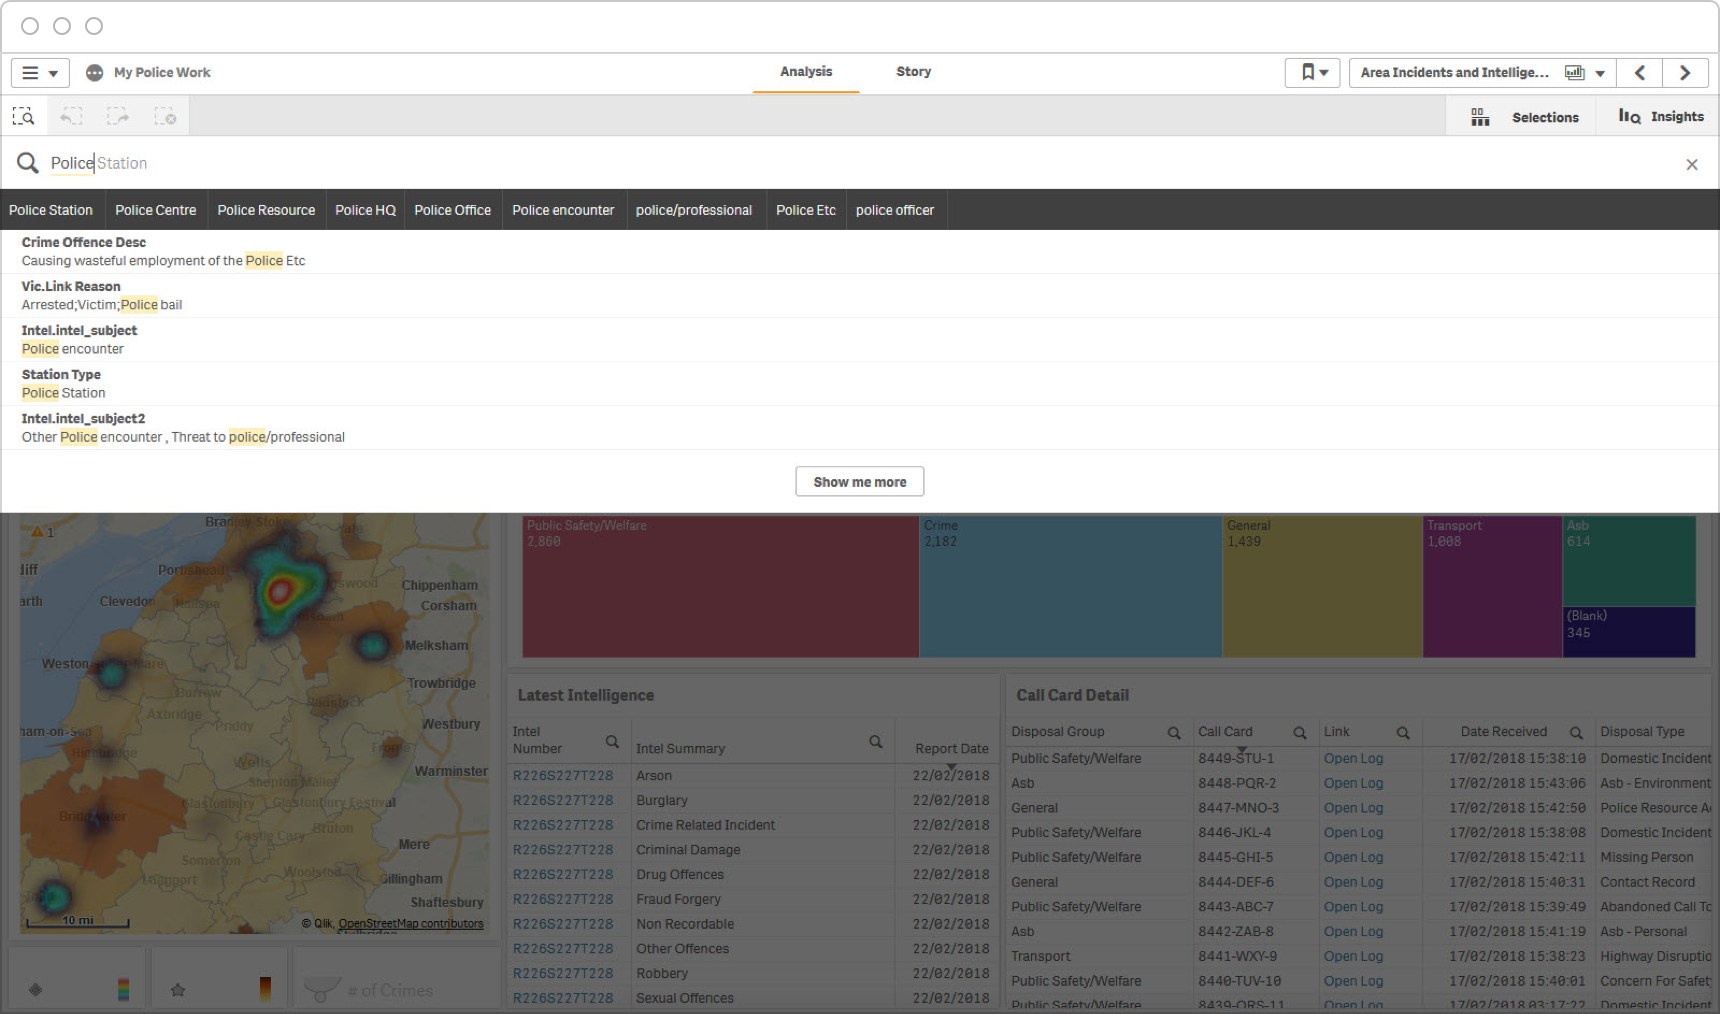
Geographic Search
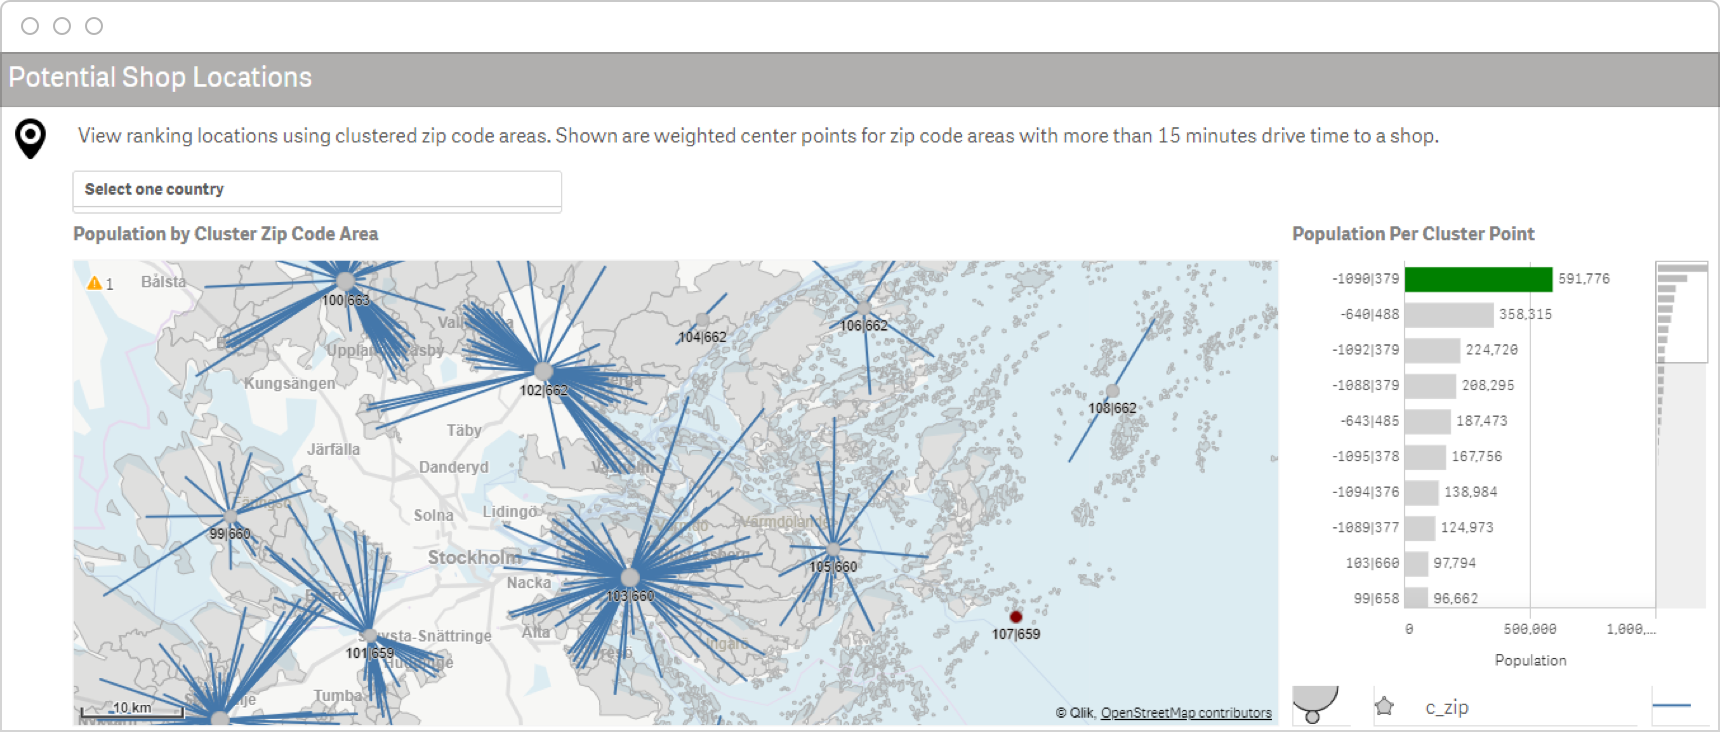
Clustering
Formatting and Annotating
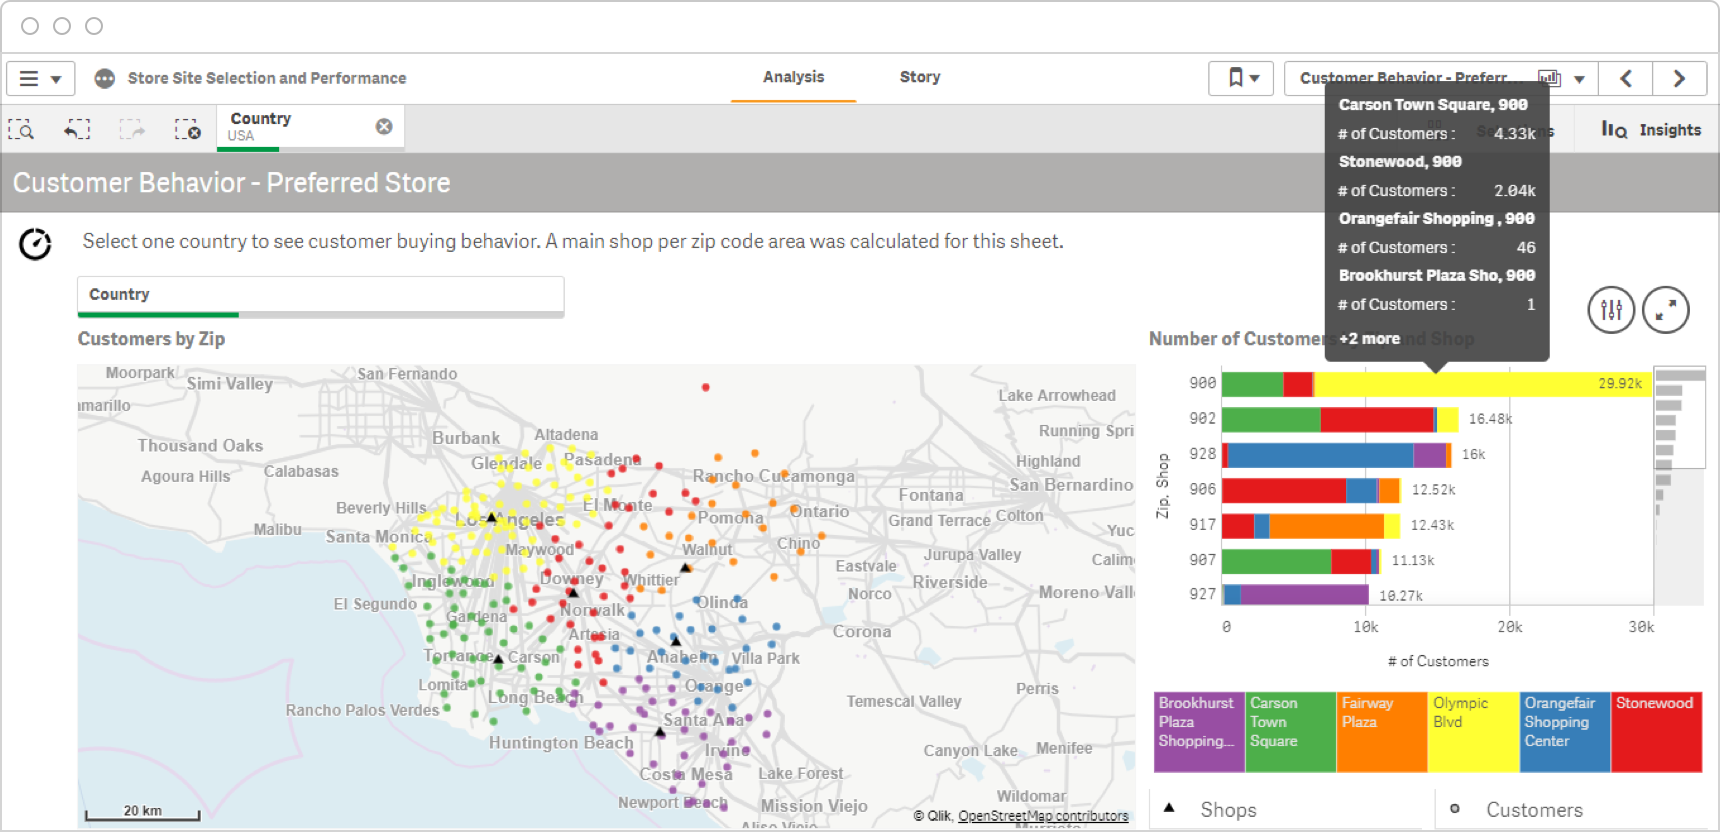
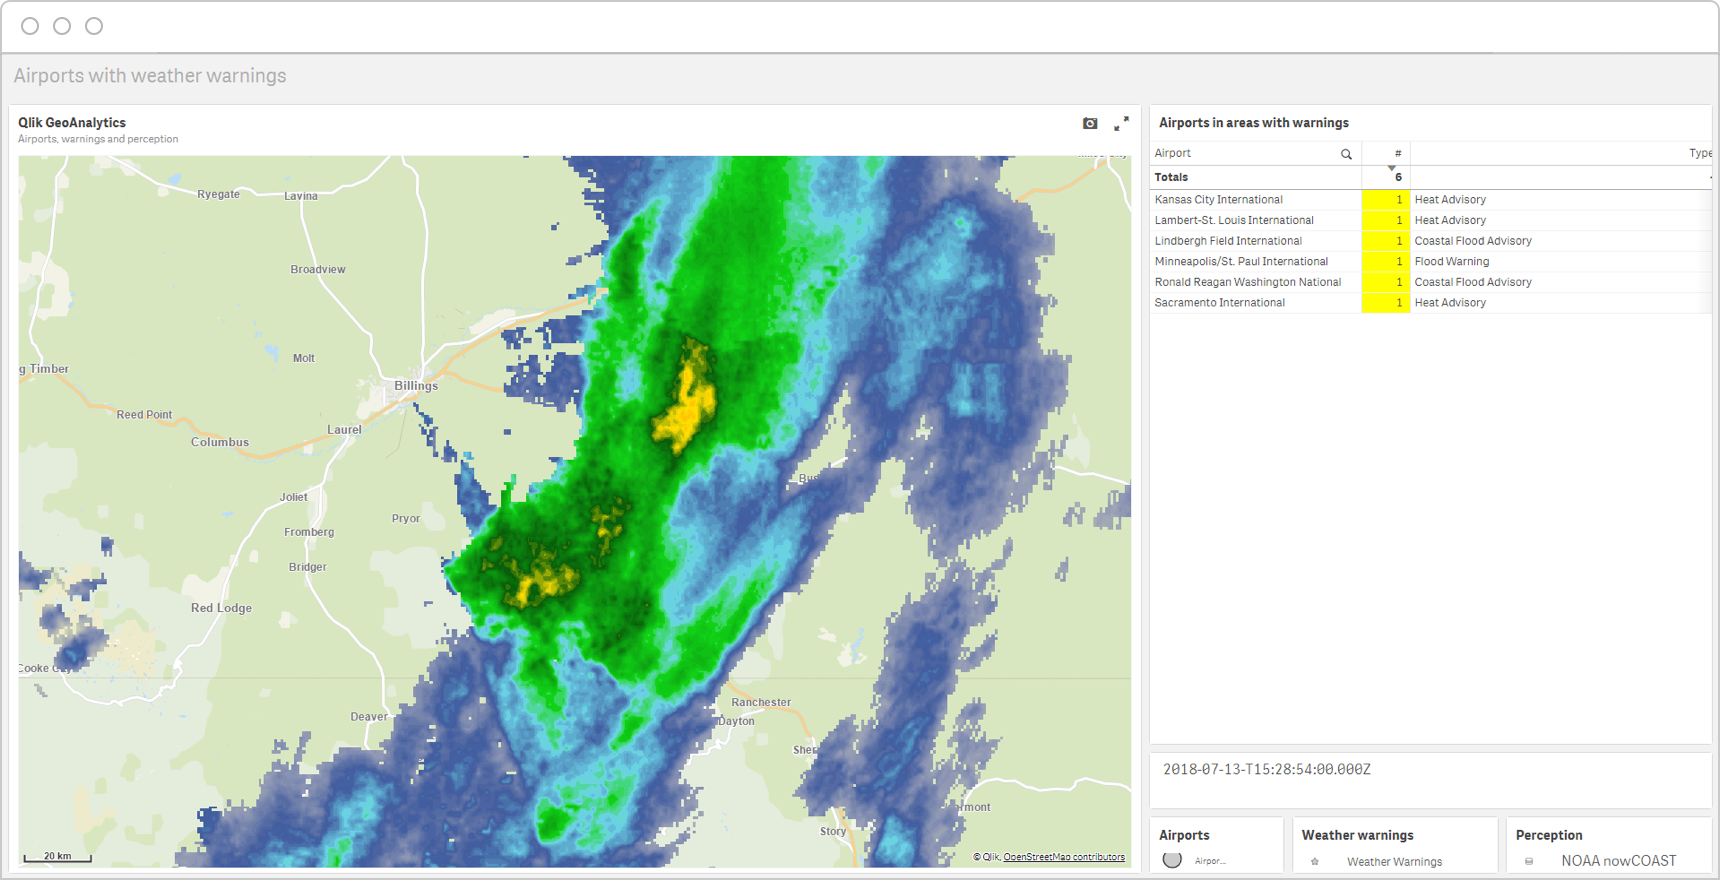
Layers
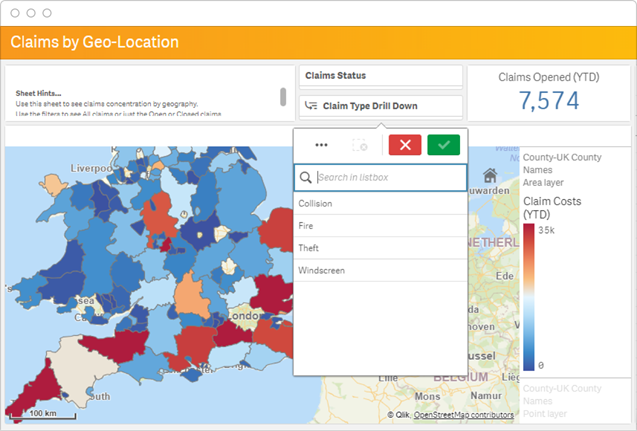
Target Highlighting
Spatial analysis examples for key industries
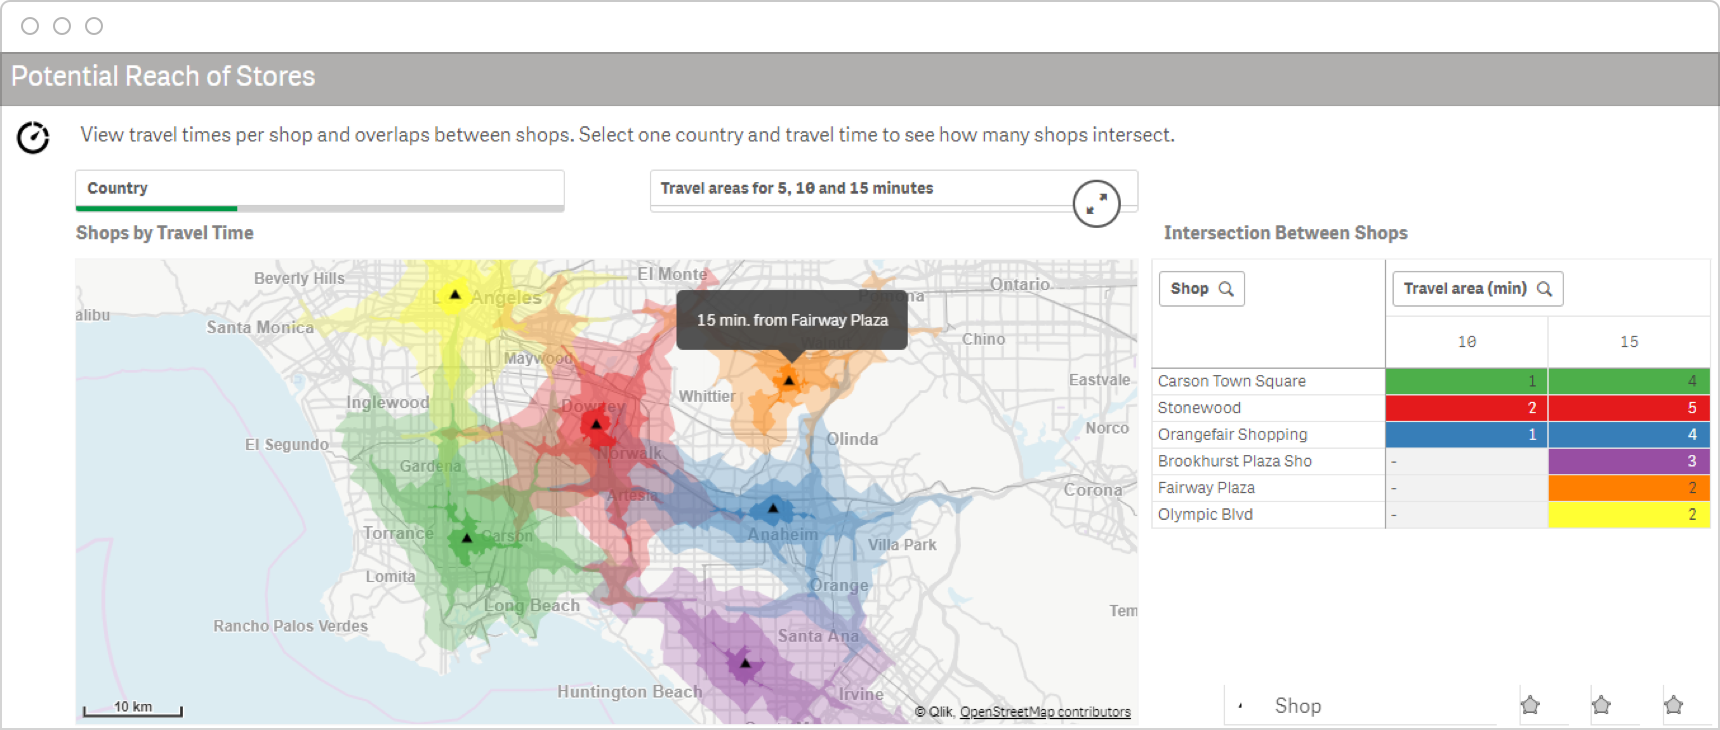
Retail
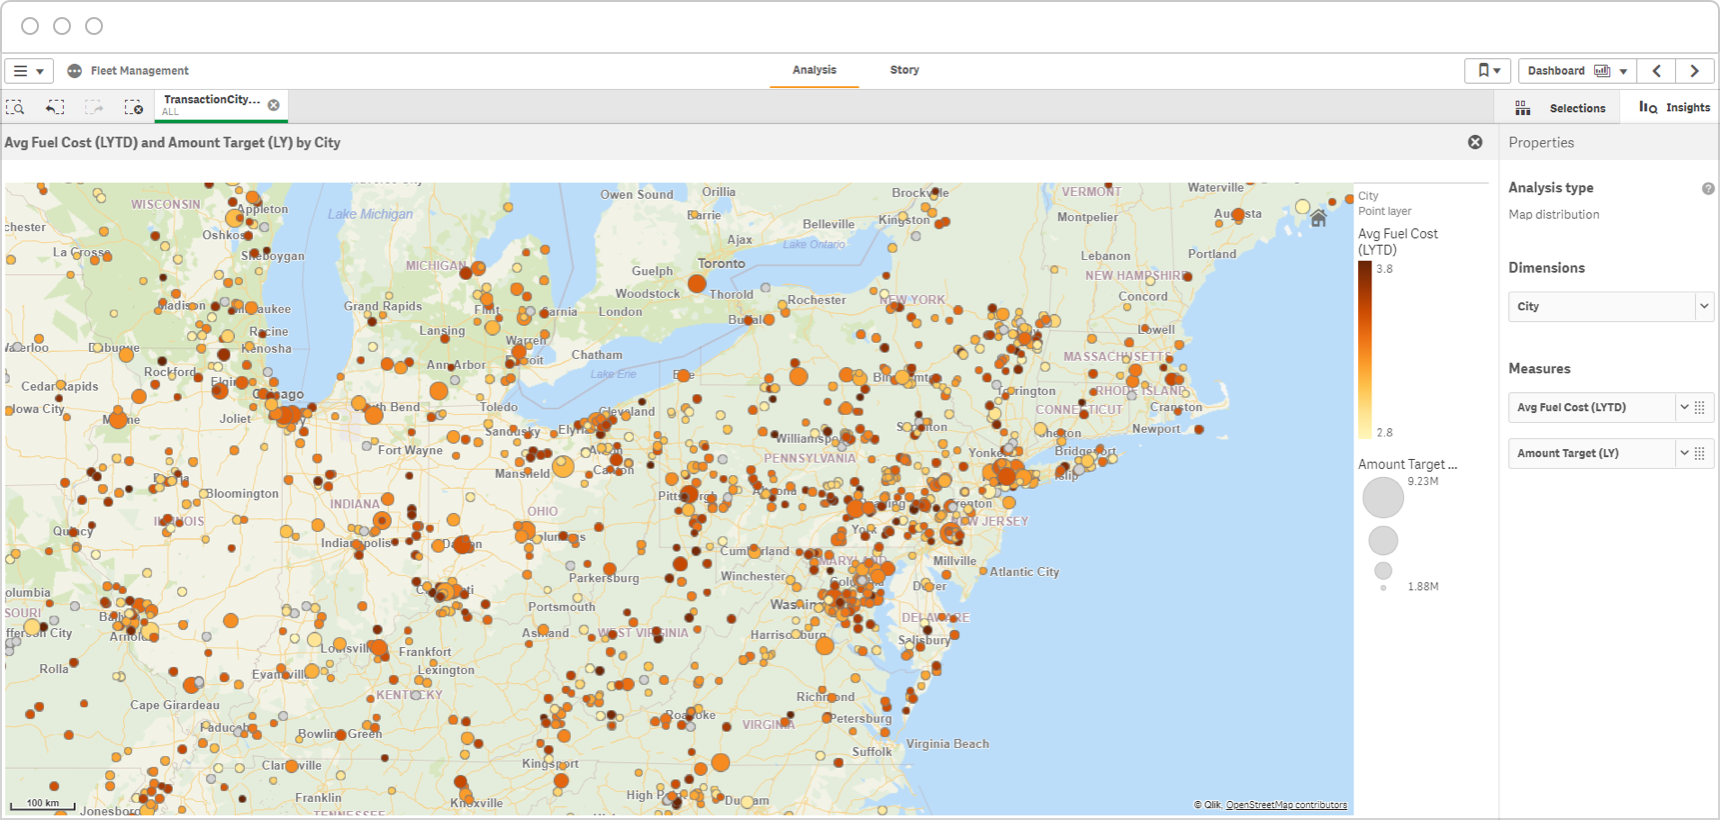
Transportation and Logistics
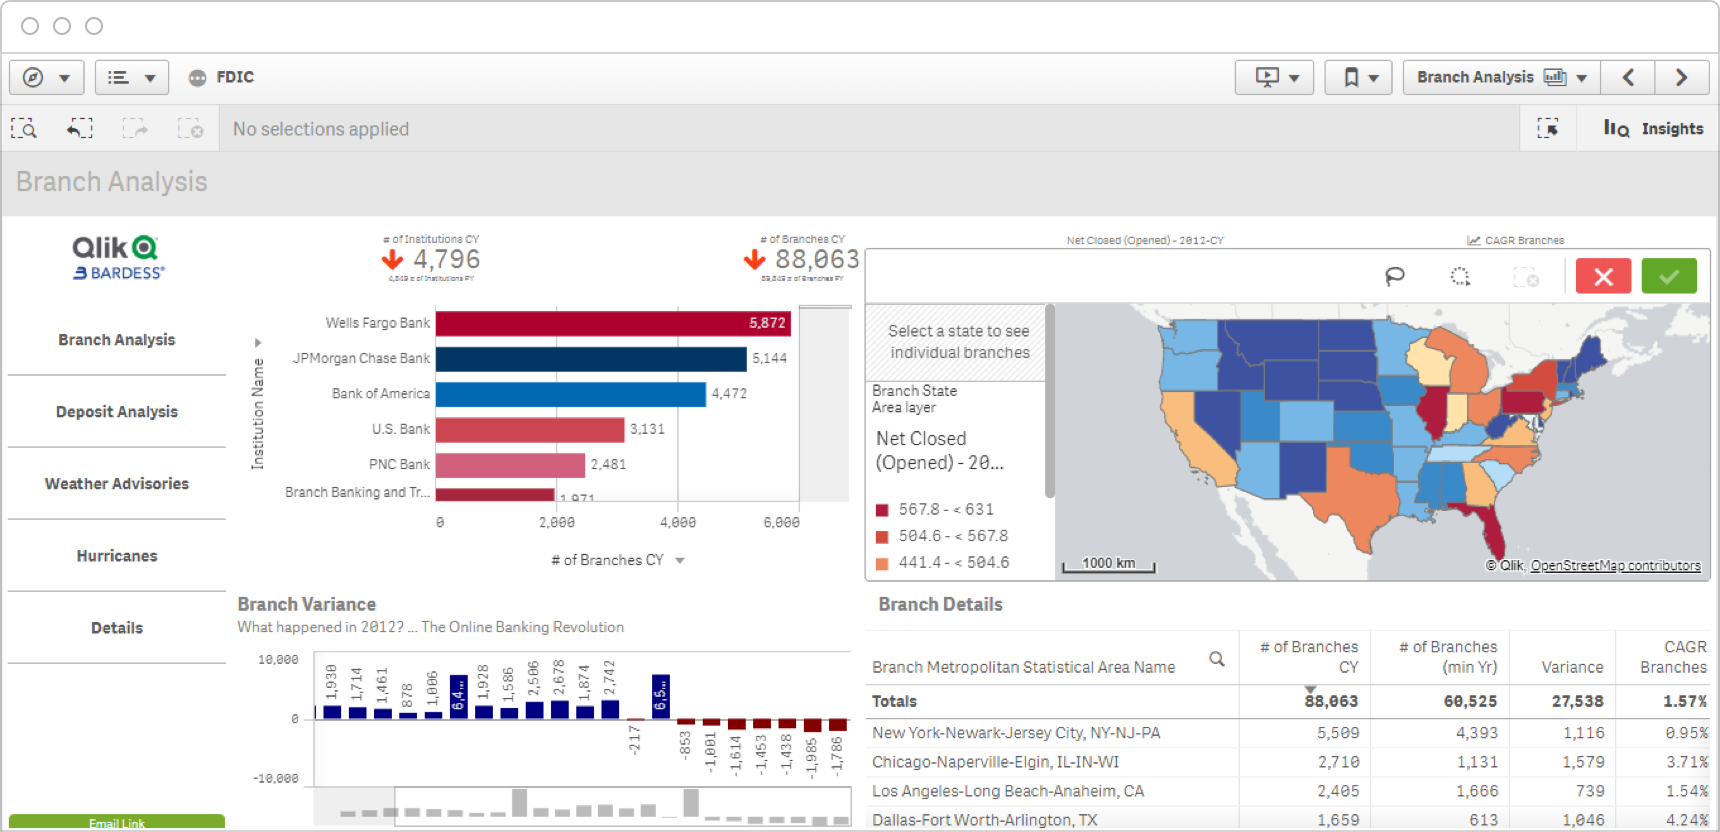
Banking
Explore more industry examples with these analytics demo applications
Key challenges of spatial analysis
Different File Formats and Structures

Data Silos

Slow Processing
Best practices in spatial analytics

Look beyond your own data

Empower users to take action

Use the power of human intuition
Take spatial analysis and insight to the next level with Qlik
A best-in-class, self-service business intelligence architecture is just one way Qlik Sense® sets the benchmark for next-generation data analytics technologies. Our one-of-a-kind associative analytics engine and sophisticated AI empowers people at all skill levels to freely explore data, make bigger discoveries and uncover bolder insights that can’t be obtained using other analytics tools. With Qlik, you can support nearly any use case and massively scale users and data, empowering everyone in your organization to make better decisions every day.
Learn more about spatial analysis and the Qlik data analytics platform.
Frequently Asked Questions
Spatial analysis means finding location-oriented insights by overlapping layers of geographic and business data onto maps. This allows you to visualize, analyze, and get a more complete view of your data to solve complex location-based problems.
What is geospatial data used for?Geospatial data can be very helpful in analyzing a wide range of use cases such as improving logistics planning and transportation for fuel and time saving or selecting store locations for optimal customer traffic.
What is geospatial big data?Geospatial big data refers to spatial analysis using location-based or geographic data sets that stretch or exceed the capacity of most current computing platforms. Geospatial data represents a large and growing portion of big data.
References
- “Zenus, Matthew, et al. “How Geospatial Analytics Can Give Your Business a Competitive Edge.” CIO.com, 2 Mar. 2017
- “Geospatial Analytics Market by Component, Type, Application, Vertical, and Region – Global Forecast to 2023.” Markets and Markets, April 2018