What is Predictive Analytics?
What it means, why it matters, and how it works. This guide provides definitions and practical advice to help you understand modern predictive analytics.
Predictive Analytics Guide
What is Predictive Analytics?
Predictive analytics refers to the use of statistical modeling, data mining techniques and machine learning to make predictions about future outcomes based on historical and current data. These predictions help guide your decision making to mitigate risk, improve efficiency, and identify opportunities.
Four Types of Analytics
Predictive analytics builds upon descriptive and diagnostic analytics (which describe the present situation) and provides a foundation for prescriptive analytics (which makes specific recommendations on your optimal course of action).
| Type | Question Answered |
|---|---|
|
What happened?
|
|
|
Why did it happen?
|
|
|
Predictive
|
What will happen?
|
|
What should we do?
|
Predictive analytics brings key benefits.
Your organization is likely flooded by big data–large, complex, and high velocity datasets from many sources. Predictive data analytics helps you use all this information to make better, data-driven decisions which can improve your business performance. It can guide your decision making across a wide range of use cases, such as increasing revenue, improving operational efficiencies, and reducing fraud.
Predictive analytics is growing rapidly.
Until the recent rise of self-service predictive analytics tools, predictive analytics required data scientists to develop custom machine learning or AI algorithms. Plus you’d have to make significant investments in hardware and data engineers to integrate, store and manage the data. Modern AutoML (automated machine learning) now makes it easier for you to build, train, and deploy custom ML models yourself. And you can secure the data storage and system power and speed you need with a cloud data warehouse.
Predictive Analytics Models and Techniques
There are a wide variety of predictive data models available. Two of the most frequently used predictive modeling techniques are regression and neural networks. The accuracy of your predictive models depends on the quality of your data, your choice of variables, and your model's assumptions. Here we briefly describe the most popular model types and techniques.
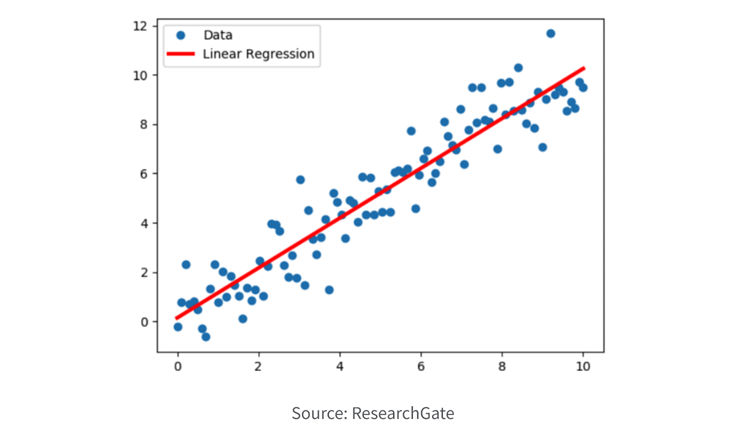
1. Regression.
Regression models are employed to forecast a continuous numerical value by utilizing one or more input variables. The objective of these models is to ascertain the connection between the input variables and the output variable, leveraging this connection to make predictions about the output variable. Regression models find extensive application across diverse domains, encompassing financial analysis, economics, and engineering, enabling the prediction of outcomes such as sales, stock prices, and temperatures.
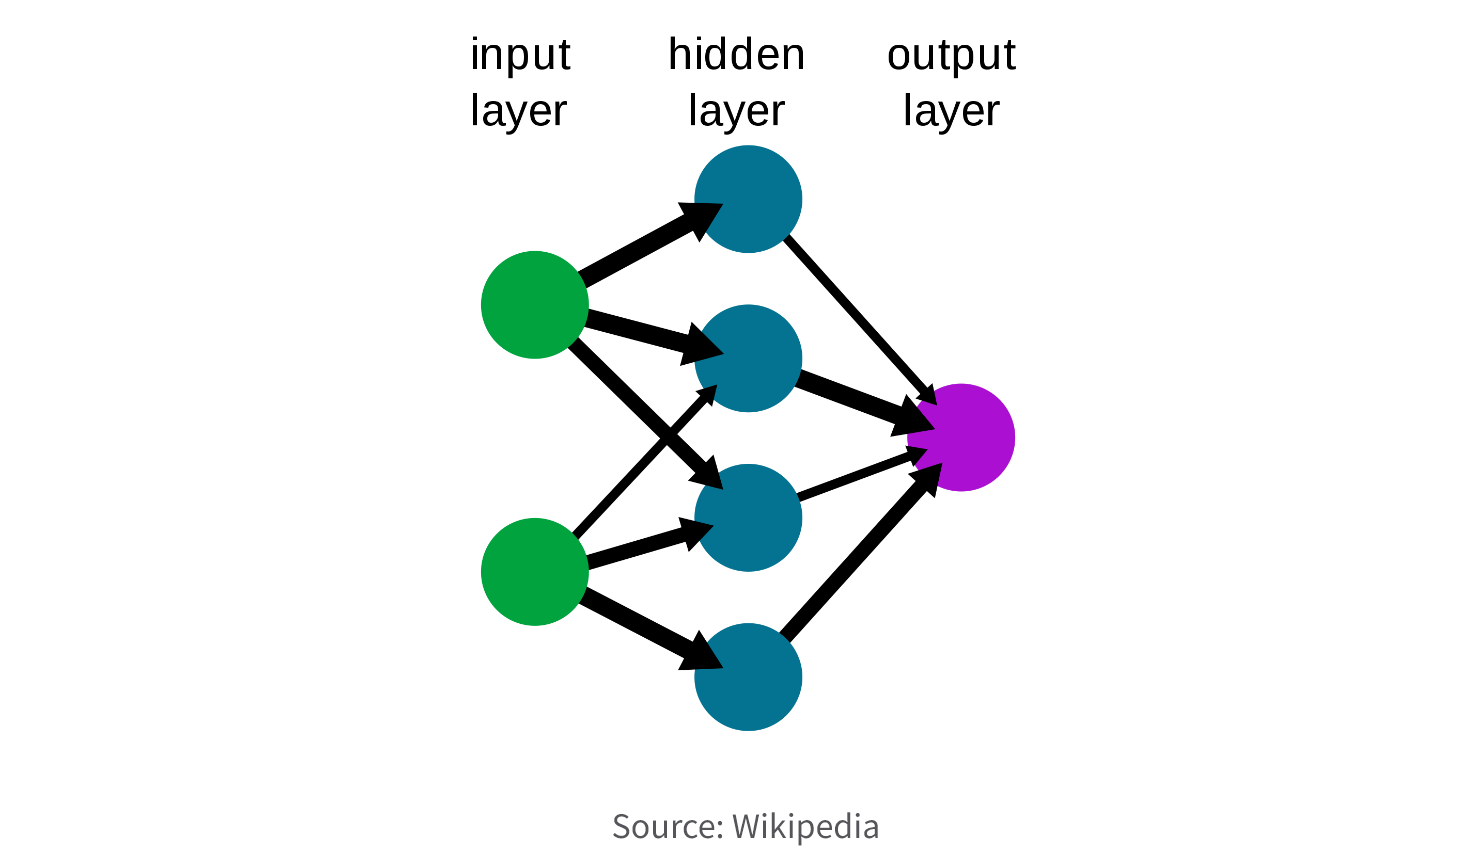
2. Neural Network.
Neural network models are a form of predictive modeling method that draws inspiration from the structure and functionality of the human brain. Their objective is to acquire knowledge about intricate relationships between input and output variables and employ this knowledge for making predictions. These models frequently find application in domains like image recognition, natural language processing, and speech recognition, enabling predictions such as object recognition, sentiment analysis, and speech transcription.
3. Classification.
Classification models are employed to categorize data into one or more predefined categories, relying on one or more input variables. Their primary purpose is to establish the connection between the input variables and the output variable, utilizing this connection to effectively classify new data into the relevant category. Classification models are extensively utilized in various domains such as marketing, healthcare, and computer vision, facilitating the classification of data such as spam emails, medical diagnoses, and image recognition.
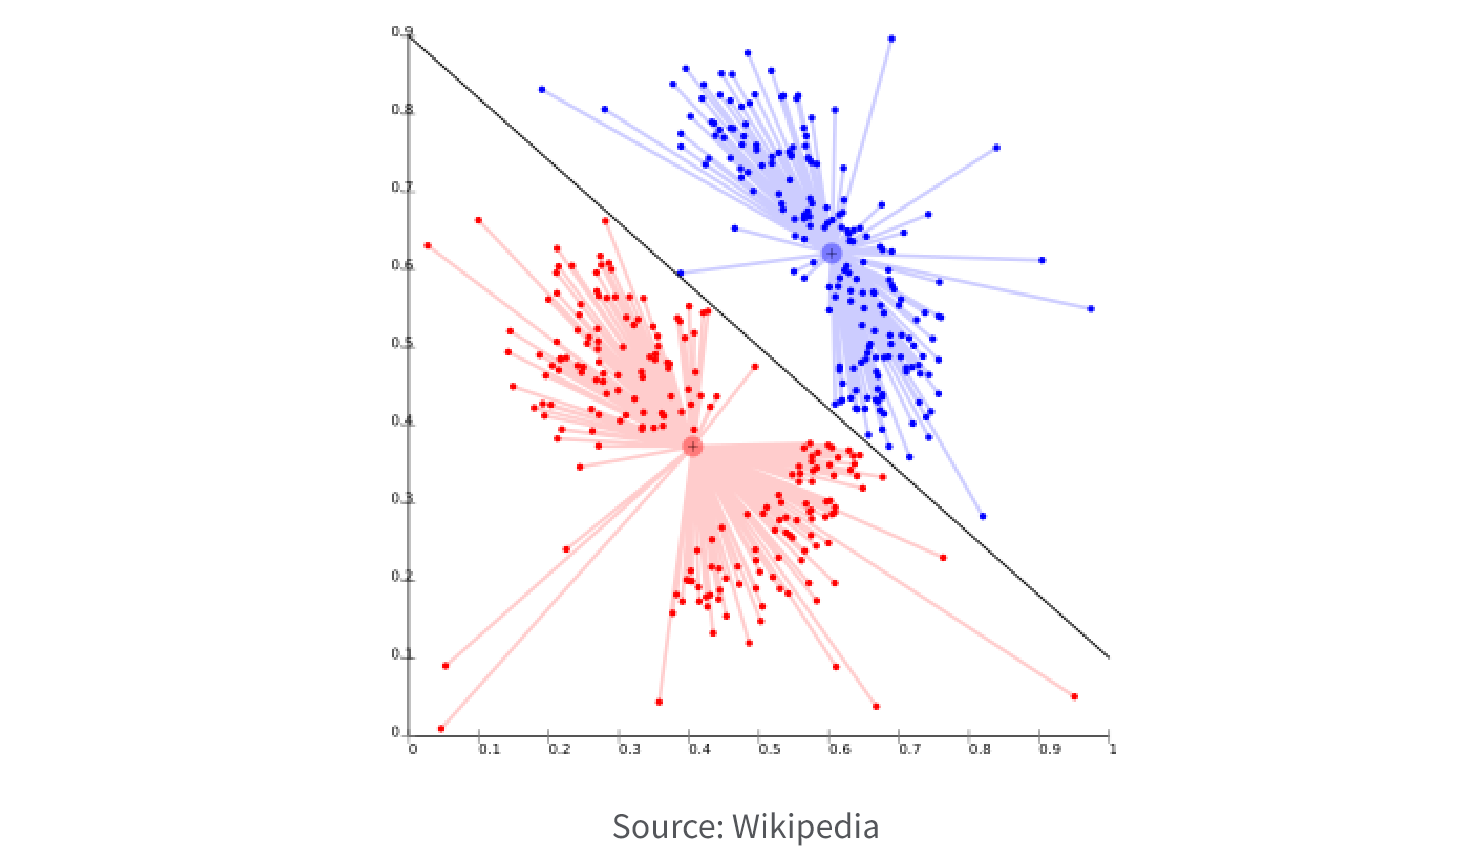
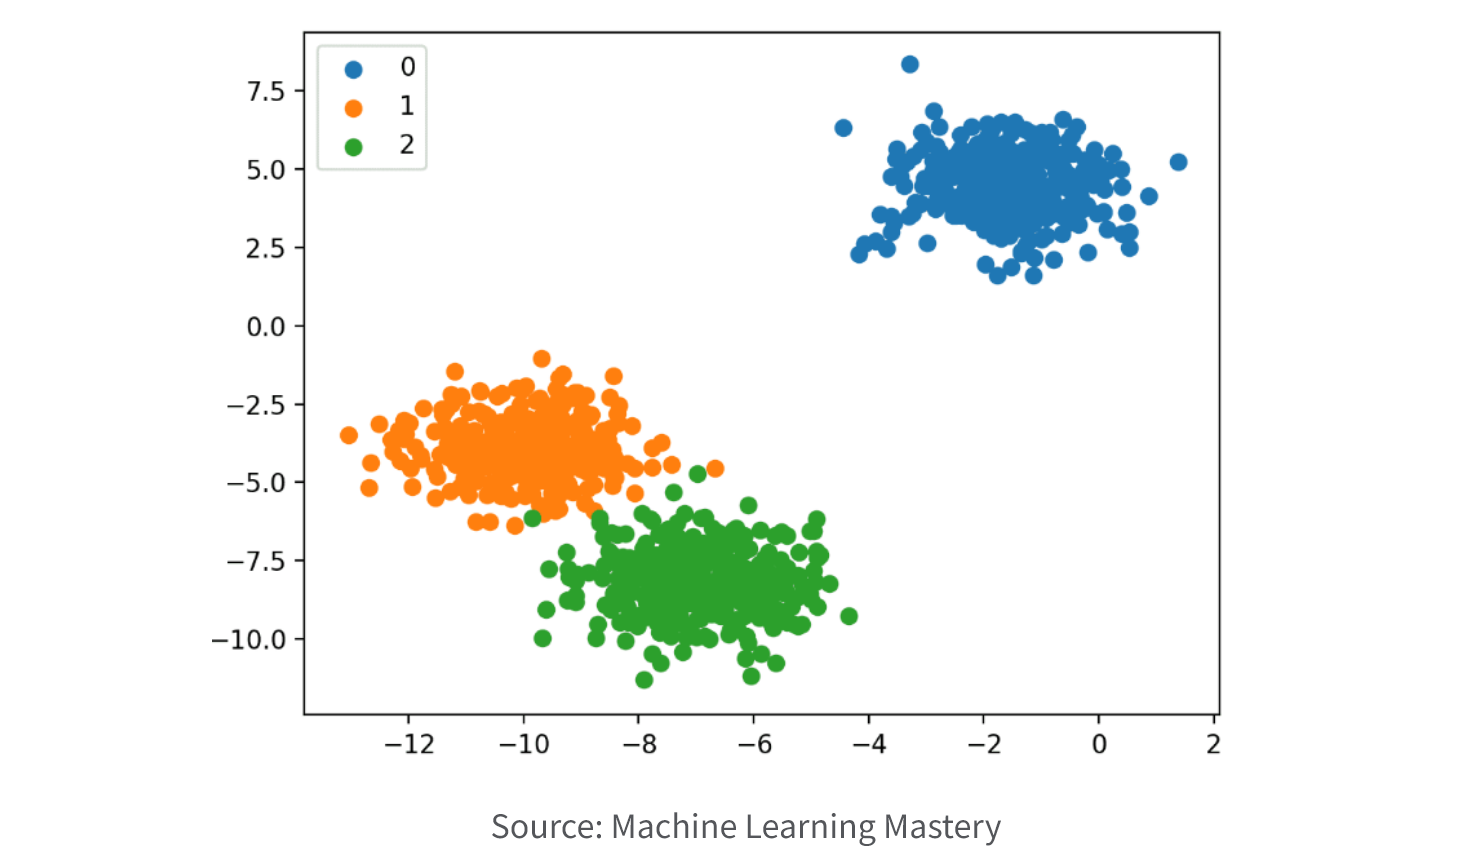
4. Clustering.
Clustering models are employed to form clusters of data points based on similarities observed in their input variables. The objective of these models is to uncover hidden patterns and relationships within the data that may not be immediately evident, and group similar data points into cohesive clusters. Clustering models are commonly utilized in tasks such as customer segmentation, market research, and image segmentation, allowing for the grouping of data such as customer behavior, market trends, and image pixels.
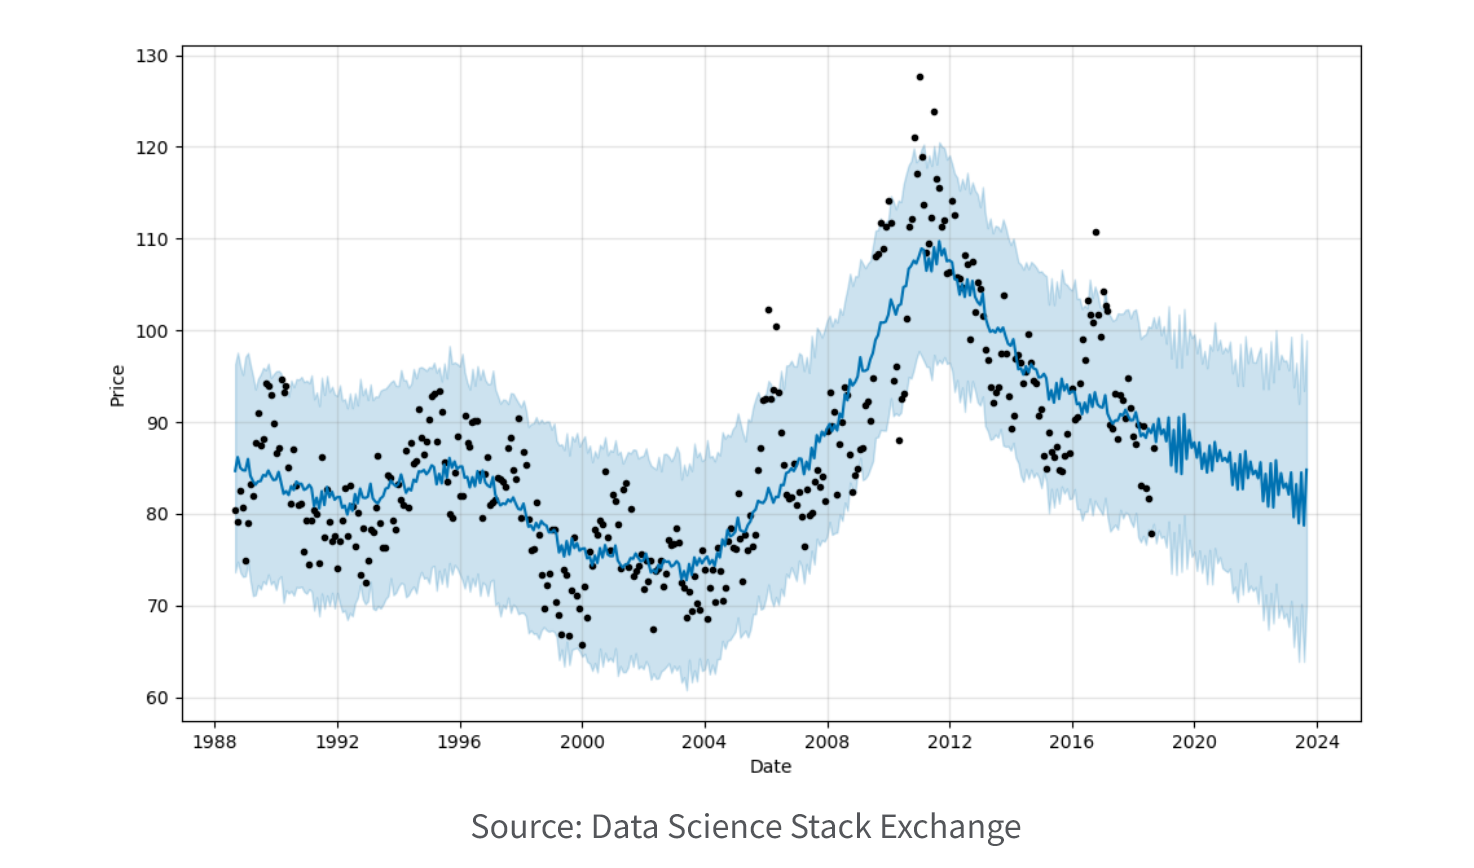
5. Time series.
Time series models are employed to examine and predict data that exhibits variations over time. These models aid in recognizing patterns and trends within the data, enabling the generation of forecasts for future values. Time series models find application in diverse fields such as financial analytics, economics, and weather forecasting, facilitating predictions regarding outcomes like stock prices, GDP growth, and temperatures.
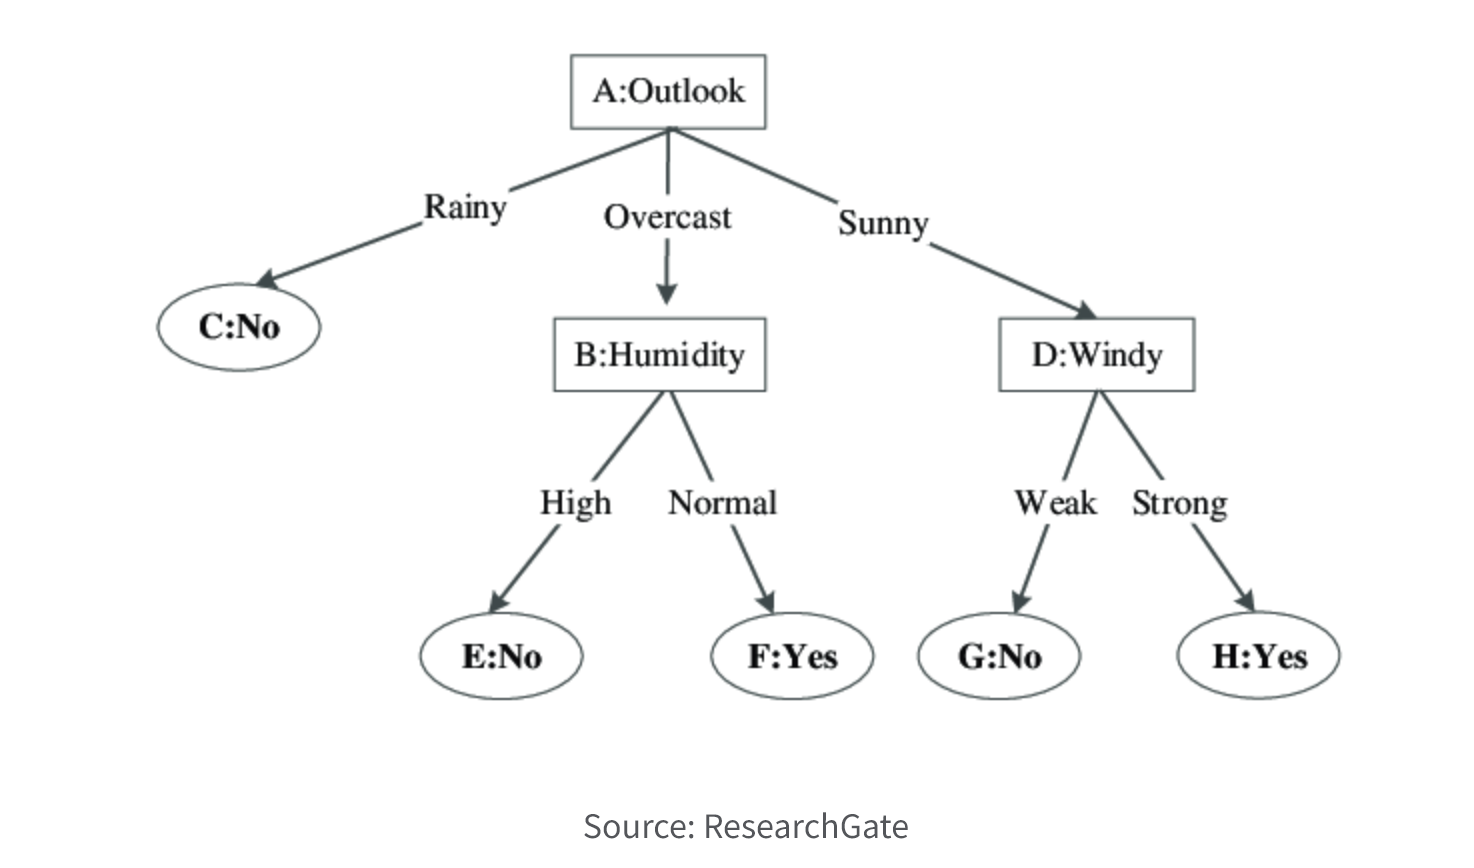
6. Decision Tree.
Decision tree models utilize a tree-like structure to represent decisions and their potential consequences. The nodes in the tree correspond to predictor variables, and the branches represent the possible values of those variables. These models aim to predict the target variable based on the predictor variables, utilizing the tree structure to determine the most likely outcome. Decision trees can be used for classification or regression tasks and are valued for their interpretability and visualization. However, they may be prone to overfitting and may not perform as well as other techniques on complex datasets.
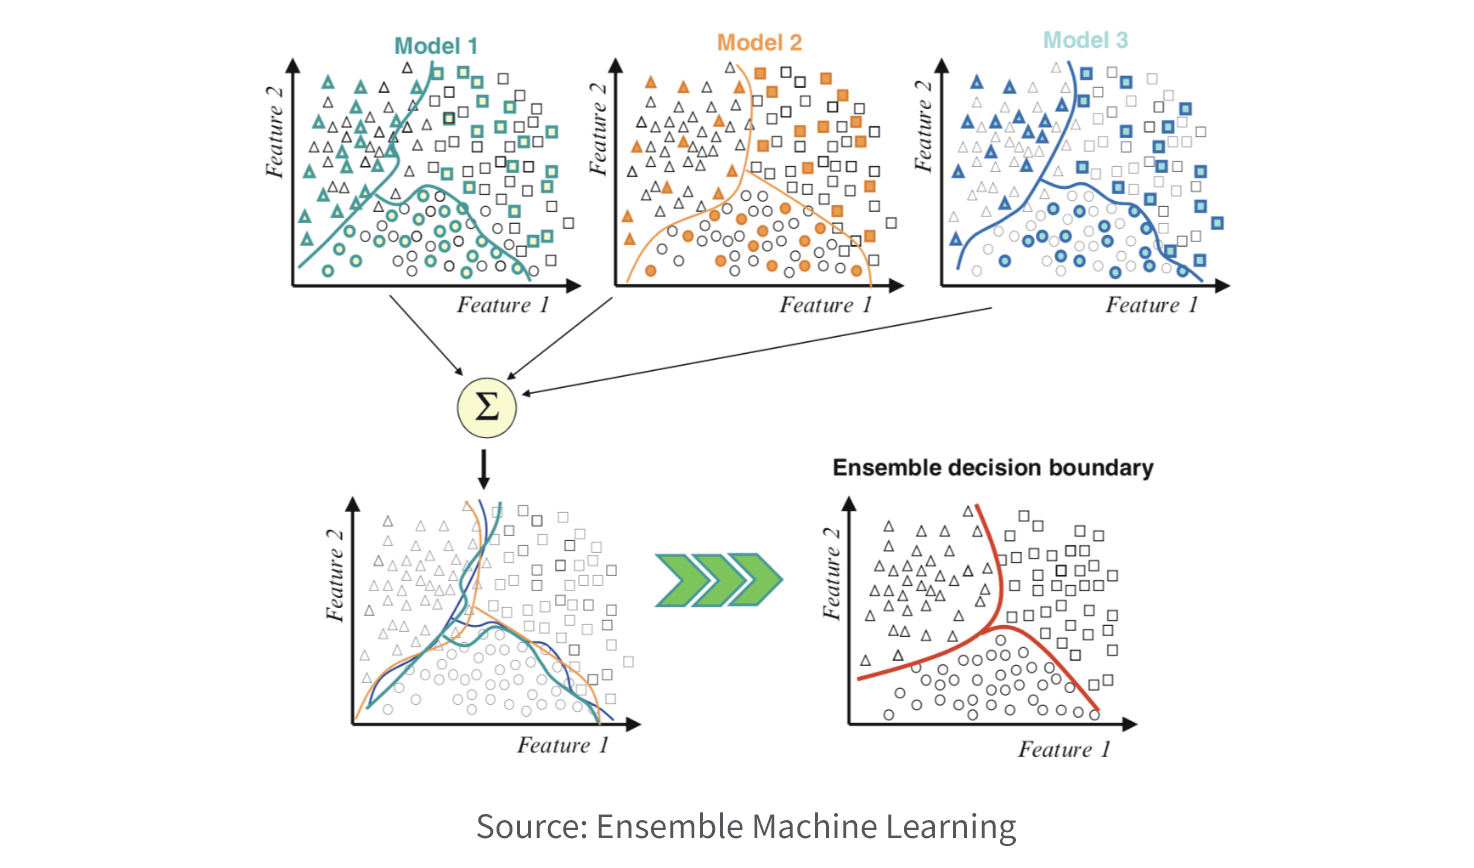
7. Ensemble.
Ensemble models enhance predictive accuracy and stability by merging multiple models. The concept behind ensemble modeling lies in the reduction of errors and biases inherent in individual models, resulting in improved overall performance. These models are applicable to both classification and regression tasks, finding utility in machine learning competitions and real-world applications that demand high predictive accuracy. Nevertheless, ensemble models can be computationally demanding and may necessitate more resources compared to individual models.
Predictive Analytics Examples
A wide range of industries and job roles leverage AI analytics techniques. Here are some common examples of how different industries use predictive analytics.
-

Insurance companies analyze policy applications based on the risk pool of similar policyholders to predict the probability of future claims.
-

Financial services firms predict the likelihood of loan default, detect and reduce fraud, and forecast future price movements of securities.
-

Retailers and CPG companies analyze the effectiveness of previous promotional activity to forecast which offers will be most effective.
-

Healthcare companies better manage patient care by forecasting patient admission and readmissions.
-

Energy and utilities mitigate safety risks by analyzing historical equipment failures and predict future energy needs based on previous demand cycles.
-

Life sciences organizations develop patient personas and predict the probability of nonadherence to treatment plans.
-

Manufacturing and supply chain operations forecast demand to better manage inventory, and identify factors which result in production failures.
-

The public sector analyzes population trends to plan infrastructure investments and other public works projects.
Move Beyond the Hype in AI Analytics
Use this checklist when you’re evaluating data analytics platforms to make sure you get the most possible value from AI.
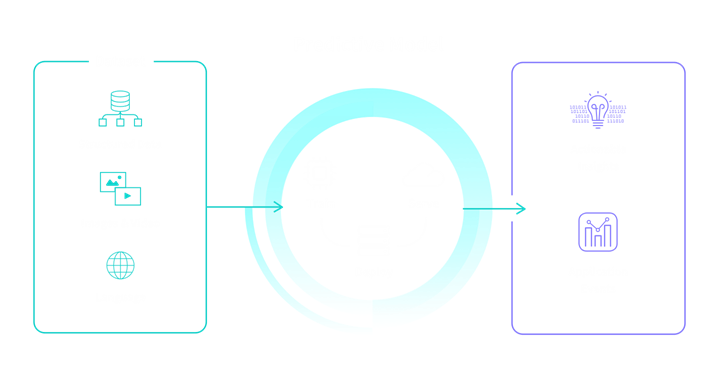
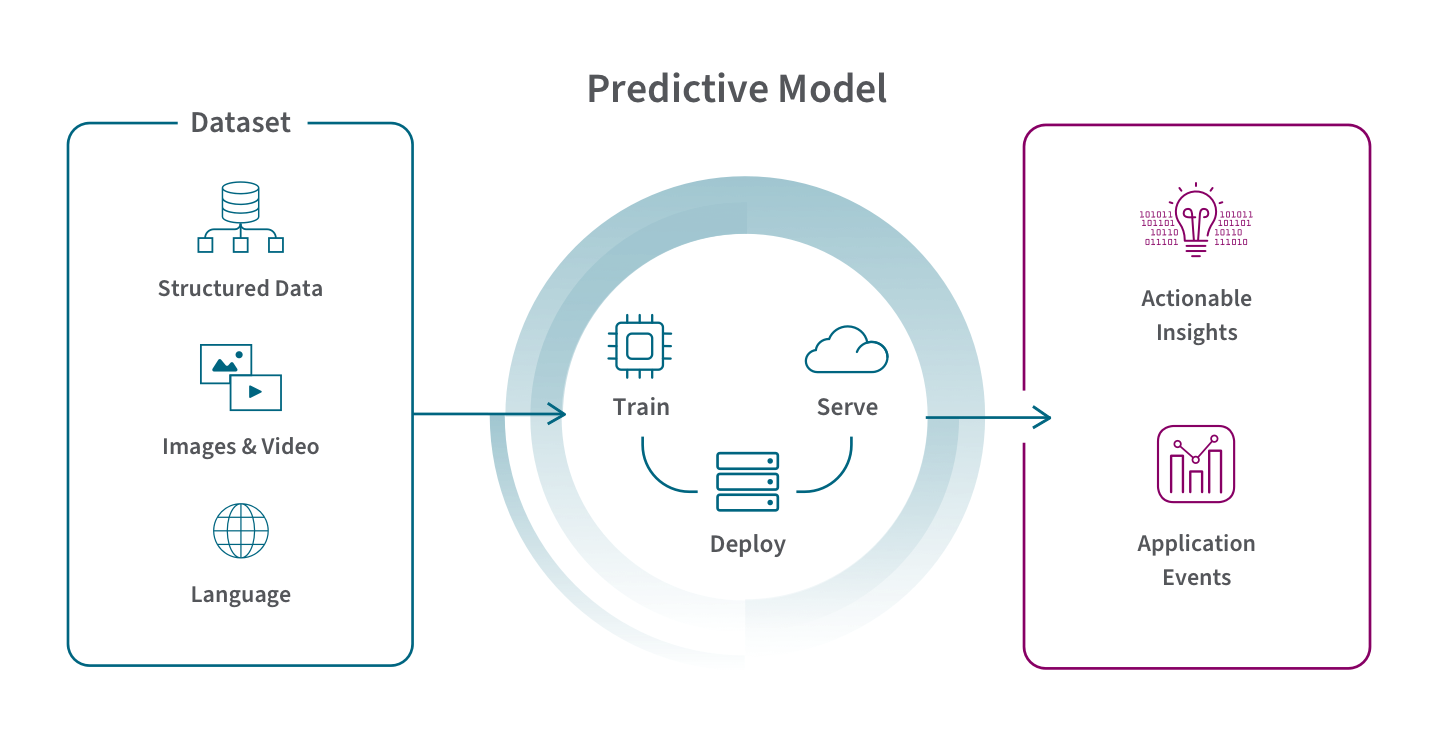
How Predictive Analytics Works
Predictive analytics uses statistical analysis, deep learning, and machine learning algorithms to identify and analyze patterns in historical and current data and then forecast the likelihood that those patterns will appear again. Your specific workflow will depend on the types of data you’re working with and the details of your specific use case(s) but here’s an overview to get you started.
1) Define your project. First you need to clearly define the business question you’d like to answer or the problem you’re trying to solve. In other words, what do you want to be able to predict? Being clear on the ideal project outcome will inform your data requirements and allow your predictive model to generate an actionable output.
2) Build the right team. While new tools make it much easier to perform predictive data analytics, you should still consider having these five key players on your team:
- An executive sponsor who will ensure funding and prioritization of the project.
- A line-of-business manager who deeply understands the business problem you’re trying to solve.
- A data wrangler or someone with data management expertise who can clean, prepare, and integrate the data (although some modern analytics and BI tools include data integration capabilities).
- An IT manager to implement the proper analytics infrastructure.
- A data scientist to build, refine and deploy the models (although AutoML tools now allow data analysts to do this).
3) Collect and integrate your data. Now you’re ready to gather the data you need and prepare your dataset. Bring in data representing every factor you can think of to provide a complete view of the situation and make your model more accurate. You’ll probably be bringing in both highly-organized and formatted structured data such as sales history and demographic information, and unstructured data such as social media content, customer service notes, and web logs. Prepping data requires you to do the following:
- Correctly label and format your dataset.
- Ensure data integrity by cleaning up incomplete, missing, or inconsistent data.
- Avoid data leakage and training-serving skew.
- After importing, review your dataset to ensure accuracy.
You’ll be working with big data, and possibly even real time streaming data, so you’ll need to find the right tools. As stated above, cloud data warehouses can now cost effectively bring the storage, power, and speed you need.
4) Develop and validate your model. The next stage involves building, training, evaluating and deploying your predictive model. There are two ways you can go about this. You can find and hire a data scientist to develop a model or you can use an AutoML tool to develop one yourself. Explainable AI techniques and processes will help you understand the rationale behind the output of your model. Also, there are two main types of algorithmic models–classification and regression–which we describe in the next section. These algorithms ultimately place a numerical value, weight, or score on the likelihood of a particular event happening in the future. You’ll need to test and refine your model multiple times to come up with the best performer, the model which generates predictions that meet what you would expect.
5) Deploy your model. Finally, you can put your model to work on your chosen dataset. You can use the results as a one-time or ongoing decision making or you can automate actions by integrating the output into other systems. Ideally, your model should automatically adjust as new data is added over time as this will improve the accuracy of the predictions.
6) Monitor and refine your model. Keep a close eye on the outputs of your model to make sure it continues to provide results you expect. You’ll likely need to tweak the model as new variables emerge. You can also improve your model’s predictions by applying data mining techniques such as clustering, sampling, and decision trees to data collected over time.