
Compare Qlik vs Tableau
This guide provides an in-depth comparison of Tableau vs Qlik to help you select the right solution for your organization. Explore the full guide below and try out our interactive comparison tool.
Qlik vs Tableau: Evaluation Guide
When evaluating Qlik vs Tableau, consider both your immediate needs as well as the larger role that BI and analytics can play across departments, customers, and partners. This guide compares Qlik Sense vs Tableau on 14 key factors.

Data Visualization
All top BI tools allow you to visualize data in charts, graphs and maps. Both Qlik and Tableau have a full range of visualizations. But visualizing data isn’t only about creating a work of art. It’s more about gaining insights. Key features help make this happen. Features large and small, like interactivity, responsive design to reformat and adjust detail level to accommodate screen and scale, or a scrollable bar chart which allows you to see the overall shape of the data and find outliers.
-
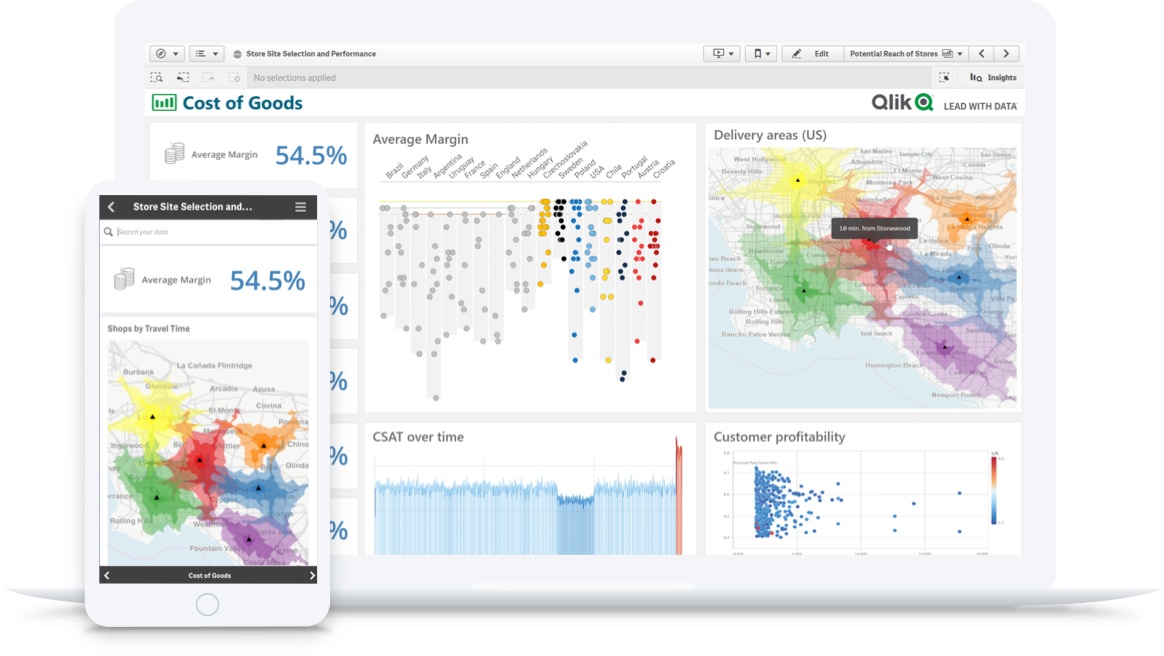
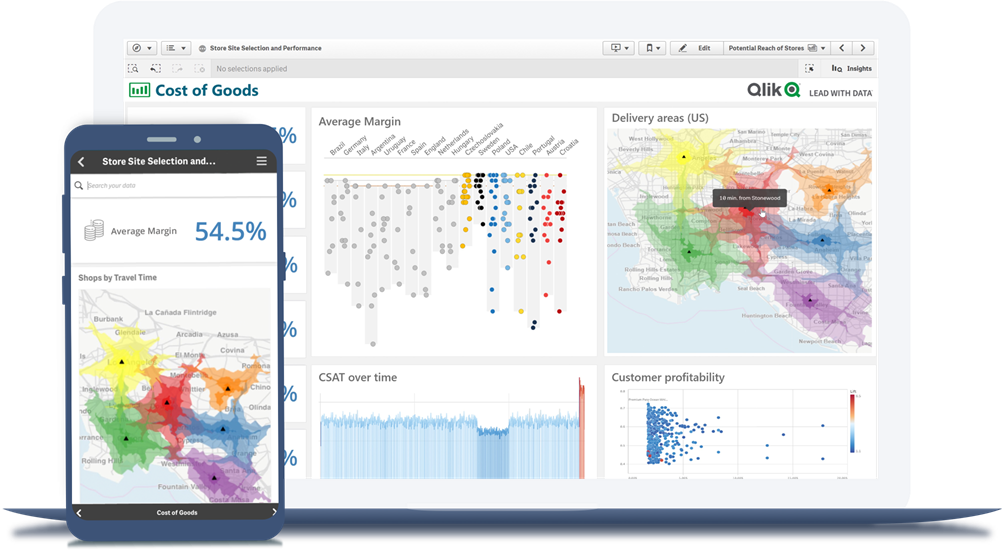
Qlik Sense
Qlik offers over 30 beautiful, fully responsive visualizations that automatically summarize data shape, highlight patterns, and pinpoint outliers. And the associative engine under the hood powers advanced geographic calculation and AI/ML to give you an interactive experience and powerful insights. -
Tableau
Tableau is well known for providing a full range of visualizations, the ability to format every part of a chart, and flexible layouts with layering. But chart design is not the main factor in helping your business user community gain insights.
“Not only was the Qlik platform substantially more user-friendly, but we found the visualization possibilities to be highly dynamic.”
-Sravani Nyayapathy*
Interactive Dashboards
You and your stakeholders will want to explore all your data in any direction, directly from within the dashboard. This will let you uncover relationships you may not have considered when you or an analyst first set up a query. Plus, you should expect AI to help you highlight outliers, create charts, and suggest new visuals.
-
Qlik Sense
Qlik's unique analytics engine is purpose-built for interactive, free-form exploration, allowing business users to explore and make discoveries without having to author content. And AI and ML make dashboards even more powerful by adding automated insight generation and natural language interaction. -
Tableau
Tableau allows you to piece charts together to make dashboards. However, their SQL-based approach limits users to filtering and drilling on predefined and linear paths in a narrow data set. The only interactivity users have is that explicitly defined by an author.
“The third advantage of Qlik Sense is its Associative Engine. This ability to quickly explore potential correlations between separate data pools is a powerful way to discover new insights.”
-Brad Ringen*

Total Cost of Ownership
There's more to making a BI platform investment than the initial purchase. The Total Cost of Ownership (TCO) factors all the costs associated with using a BI solution. From implementation to usability and scalability over the years. Major cost considerations include infrastructure, systems setup, app development, cloud computing cost management, security, usability, systems admin, and support.
-
Qlik Sense
Qlik’s total cost of ownership is lower than Tableau. And Qlik has no additional or hidden costs as you scale. -
Tableau
Tableau requires additional investments in software and infrastructure as you scale.
“The price comparison is very misleading.”
- Tomasz Wojcik, Thermoplast**

AI-Powered Analytics
Artificial intelligence (AI) and machine learning (ML) are resetting the expectations of a modern BI tool. Augmented analytics suggests new insights and connections and this helps you quickly analyze your data, increases your productivity, and helps you make better data-driven decisions.
-
Qlik Sense
With AI and ML integrated into its platform at a foundational level, Qlik supports a full range of augmented analytics capabilities. This includes automated insight generation, natural language analytics, and authoring assistance. Together these capabilities offer deeper insight, help more people become data literate, and speed time to value. -
Tableau
While it includes narratives, Tableau lacks a true form of automated insights. Tableau’s NLQ, called Ask Data, can produce a simple answer to questions users ask. But it only supports English and works with a data source, not with the business logic built into workbooks, so it can’t leverage the insights your analysts have built.
“Conversational analytics in Qlik Sense allows us to give the intelligence that people in the field need right where and when they need it.”
- Pavan Arora*

Machine Learning and Predictive Analytics
Machine learning is the process of creating models from historical data in order to make future predictions. Automated machine learning allows you to leverage the power of predictive analytics in more user cases not handled by data scientists.
-
Qlik Sense
Qlik AutoML allows analytics users to easily create ML models and generate predictive analytics, helping you move from historical analysis to predictive and prescriptive. With full explainability, you can understand not just what might happen but why, so you can take action. And you can do this as an analytics user without having to be a data scientist. -
Tableau
Salesforce offers Einstein Discovery which provides key driver analysis but lacks true predictive capabilities. Einstein doesn’t scale given its very small data limits. Furthermore, it’s a separate cloud, not part of the Tableau experience, and only works on Salesforce data. So you wouldn’t be able to analyze your HR, Finance, or other separate data.
“We were stumbling blind, trying to figure out what would stop churn and it was frustrating trying to find something that would move the needle. Now, machine learning has really given us direct clarity as to what will make a difference. Instead of guessing, we now know what will bring results.”
- Ben Dean*

Many Use Cases (On One Platform)
Your organization should be able to support all BI use cases using the same data and the same platform. This is because you may have many different types of users, such as analysts, engineers and business people performing many different use cases beyond just visualizing data–like embedding analytics, enterprise alerting, and collaborating on dashboards.
-
Qlik Sense
Users of all skill levels across your business can engage in the best way for them, from data exploration to real-time analytics, to natural language interaction, on the same platform with a common analytics data pipeline, analytics engine and AI capabilities. -
Tableau
Tableau is primarily a self-service authoring tool for analysts to create data visualizations. While strong at styling content, it lacks the flexibility to allow users to explore independently and lacks the scalability and analytical sophistication to address more complex use cases.
“Not only has Qlik's partnership brought us where we are today, but it's been used for dozens of different use cases around our organization.”
- Jason Ferriggi*

Triggering Action
It’s not enough to create dashboards and visualizations. Your platform should have the ability to initiate action. This can take the form of prompting human action through sophisticated alerting or orchestrating events in downstream systems.
-
Qlik Sense
Qlik offers intelligent, fully data-driven alerting that is independent of any particular visualizations, delivered through email and mobile push notifications. And with application automation, you can orchestrate events and actions in all kinds of downstream systems and workflows. -
Tableau
Tableau allows authors to monitor the value of a point on a chart, but it lacks the ability to create complex rules that would allow monitoring for data conditions. And without acquiring third party software, automations are limited to Salesforce Flow only.
"We believe the combination of self-alerting and mobility is responsible for the continual growth in our user base"
- Rob O'Neill*

Governed Self-Service
You want everyone in your organization to trust their data, analytics and insights. You also want everyone to work quickly without having to wait for IT or analysts. This means your tool should allow you to control your data and content with a centralized management capability that uses rules-based governance without restricting what users can accomplish.
-
Qlik Sense
Qlik centralizes and unifies your data and analytics in the cloud, creating governed data models with robust data security. And all content creation happens in the cloud, where it’s governed and controlled at every step. Plus, governed libraries provide reuse and standardization for analytics. -
Tableau
Tableau’s primary authoring environment is on the desktop, where governance is not possible. As a result, authors could create incorrect analytics without any oversight. In addition, to personalize content you must make copies, even for minor changes, creating duplication and complexity to manage.
“Not everyone is a data geek. Creating a simple-to-use application gives everyone—regardless of their comfort with data—the tools they need to better perform their job.”
- Michael Taylor*
Mobile BI
As workforces become more mobile, keep in mind that you and your teams need to be able to explore and analyze data and share insights wherever you happen to be.
-
Qlik Sense
Qlik offers a fully-native mobile app with its analytics engine running locally and push alerting. With responsive design and touch interaction native to the Qlik platform, you get fully interactive online and offline exploration and integrated alerting without having to redesign apps for mobile access. -
Tableau
Tableau isn’t responsive but does allow you to define layouts for mobile use. But they also recommend turning the feature off for better performance. For the user, Tableau only lets you download one sheet from a workbook to the mobile device. And you’re not able to filter; you’re only able to highlight one value at a time and scroll to find that value in related charts.
“Qlik is much more intuitive and offers way better mobile support than Tableau.”
-Ryan Hanson**

Scalability
You need a complete, up-to-date view of all relevant data. Plus, you may need to support hundreds or thousands of users across your organization. This means you’ll need a tool that can handle data at any scale without compromising performance or driving up costs and can integrate and combine data from any source, as close to real-time as possible.
-
Qlik Sense
Qlik’s associative engine provides instant calculation performance, even with massive data sets, unanticipated questions, and high numbers of users. And, with Qlik's robust incremental update and partial reload features, you can keep data fresher in a much smaller build window. -
Tableau
Tableau’s engine slows dramatically when it tries to handle large volumes and disparate data, especially when attempting complex analytics. And trying to scale this across 1,000s of users will only make performance worse.
“Near the beginning of our journey with the analytics platform Qlik, we had about 2,000 users. However, as word spread, the number of interested staff grew exponentially. Roughly a year later in 2020, we had nearly 20,000 users on the platform. As of the first quarter of 2021, more than 35,000 people were engaged.”
-Axel Goris*

Embedded Analytics
Embedded analytics refers to incorporating full analytics capabilities within other processes, applications, and portals across an organization. It lets your employees, partners, suppliers, and customers make better, data-driven decisions from within the systems they already use.
-
Qlik Sense
Qlik’s platform was built API-first using modern standards. This means you can embed a dashboard–and individual numbers, values, and metrics–within the latest web and application technologies. -
Tableau
Tableau’s APIs are limited, which means you can only embed a complete dashboard, not individual values.
“Qlik’s complete set of open APIs enables us to fully customize analytics solutions, rapidly develop new custom apps, visualizations, and extensions, and embed fully interactive analytics within the applications people use every day.”
- Aaron Growitz*

Combining Data Sources
To get a holistic view of your business, your BI tool should be able to easily bring together data from hundreds of data sources such as apps, databases, and cloud services. Robust data prep and combination capabilities are essential for applications that go beyond just a single source. And, they must not be limited by the complexities of SQL.
-
Qlik Sense
Qlik’s associative engine is the key to combining many different types of data from many different sources, at scale, without the limitations of SQL-joins. And, with both graphical data transformation and powerful scripting, you can deal with the most complex of data preparation challenges. -
Tableau
Tableau Prep and Tableau Desktop do provide data prep capabilities. However, both struggle in different ways at combining and preparing complex data at scale. For example, Tableau Prep creates a flattened data table while Tableau Desktop simply doesn’t scale. This requires you to find other solutions for data prep.
“Databases can be huge, with information coming from multiple sources. Qlik’s associative selection model and powerful data engine make it simple to turn piles of data into wisdom.”
-Sandra Norman Andersen*

Platform Architecture
You shouldn’t be limited in your cloud strategy or where your data resides. Your BI tool should have a platform-agnostic, multi-cloud architecture that lets you deploy in any environment, from on-premise to cloud to hybrid.
-
Qlik Sense
As an independent platform, Qlik offers you total freedom and control for your data, whether it resides in one or more cloud environments or on-premises. Qlik provides a full enterprise SaaS environment and on-premises or private cloud deployment options. Learn about Qlik Cloud. -
Tableau
With Tableau, you host it or they do - there is no hybrid option. And given that Salesforce owns Tableau, you might wonder where your data could end up and whether it could get locked in, especially with the launch of Salesforce Data Cloud.

Data Literacy Support
Most vendors will teach you how to use their tool. Today, you need more. You need people at all levels of your organization to be data literate. They should be able to ask the right questions of data and machines, make data-driven decisions, and communicate meaning to others.
-
Qlik Sense
Qlik makes it easy for anyone, at any skill level, to explore their data. Plus Qlik offers data literacy training programs for any user. -
Tableau
Tableau requires you to be an author to interact with data and to benefit from Tableau’s data literacy initiative. All other users have to go back to the author for a new report when they want to explore deeper.
“We use features like Qlik Continuous Classroom to help people to develop data literacy.”
-Vladimir Baklanov*
Should you compare QlikView vs Tableau?
No. QlikView was Qlik’s first product introduced over 30 years ago, leading the data discovery revolution. Many customers still use and love QlikView and while Qlik continues to support them, Qlik Sense has been the lead product for almost a decade.
When Tableau compares itself to Qlik, they focus on QlikView. This is misleading, as they’re not comparing themselves to the modern platform, Qlik Sense.
This results in misinformation and confusion for the customer.
Popular resources to help you compare Qlik vs Tableau
-
 Analyst Report
2023 Gartner Magic Quadrant for BI and Analytics
-
 Whitepaper
Qlik Sense Enterprise SaaS Technical Overview
Why do customers choose Qlik?
Compare Qlik Sense® to other data analysis tools and you’ll see why Qlik sets the benchmark for a new generation of data analytics. Our one-of-a-kind associative analytics engine and sophisticated augmented analytics let you freely explore all your data to make bigger discoveries and uncover insights you can’t find using other data analytics tools.
And with a true governed multi-cloud architecture, deploy any way you want, massively scaling users and data without compromising security or performance. Qlik helps you empower people throughout your organization to make better decisions, take smarter actions and drive stronger business performance, every day.
*Upshot by Influitive Interviews
**Qlik User Survey